Monthly swaps data review: analysing CCP and Sef volumes
Data shows strong growth at LCH and JSCC, while OIS products surge

Now that we have six months of 2017 figures, it is interesting to compare the numbers to the same period in 2016 and examine which clearing houses, currencies, products and execution venues are up and which are down.
Global cleared volumes
I began my first monthly swaps data review article in the March issue with a chart of the monthly gross notional volume of global cleared swaps in group of four (G4) currencies at the major clearing houses, so let’s update this.
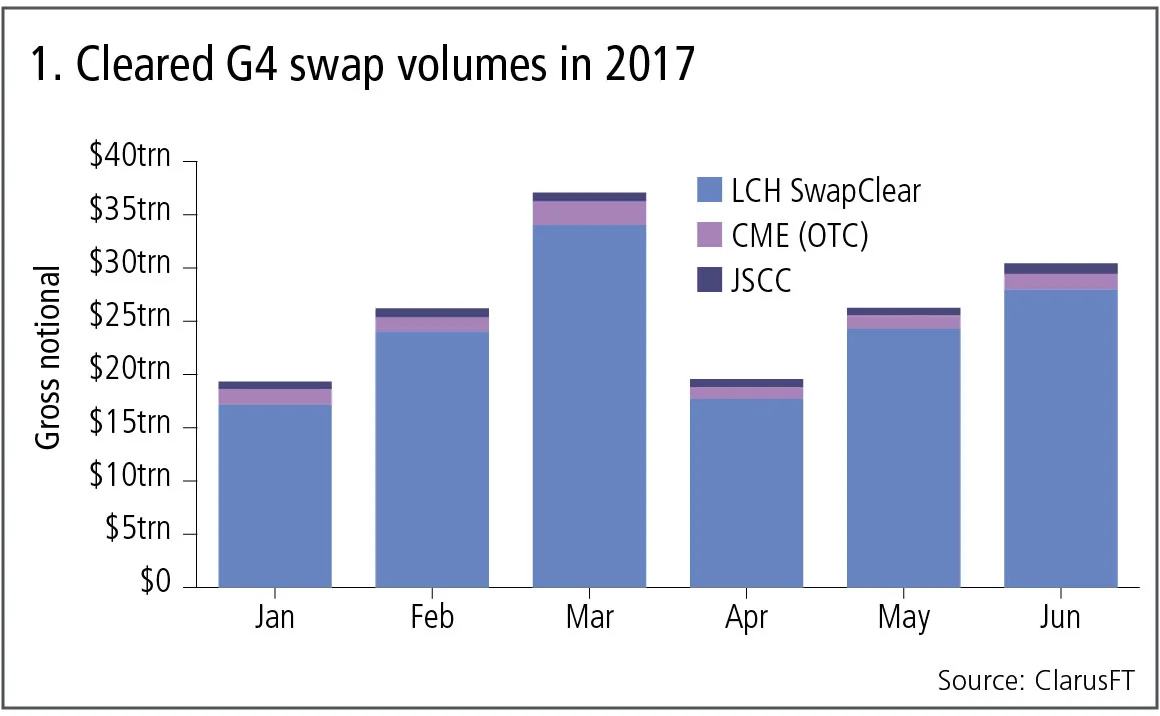
Figure 1 shows:
- Cumulative volume of $160 trillion gross notional in the six-month period.
- Volumes increasing up to the last month in each quarter and then dropping, so March 2017 and June 2017 are the high months this year. The pattern is driven by US dollar overnight indexed swap (OIS) volume behaviour.
- A similar, but less pronounced, pattern is also seen in the 2016 data (not shown).
- LCH has by far the largest volume. Cumulative volume in the first six months of 2017 is $145 trillion, up 43% from the equivalent period in 2016, with peaks of $34 trillion in March 2017 and $28 trillion in June 2017.
- CME’s over-the-counter derivatives cumulative volume in the first six months of 2017 is $8.8 trillion, up 9% from the equivalent period in 2016. Its peak month was March 2017, with volume of $2.2 trillion.
- The Japan Securities Clearing Corporation’s (JSCC) cumulative volume in the first six months of 2017 is $4.9 trillion, up 36% from the equivalent period in 2016. Its peak month was June 2017 with volume of $1 trillion.
- Eurex Clearing’s $360 billion cumulative gross notional in the first six months of 2017 is too small to register on the chart, but shows signs of growth. Its peak month was June 2017 with volume of $88 billion – an increase of 60% in cumulative volume from the equivalent six-month period in 2016.
- Spain’s Bolsas y Mercados Espanoles (BME) had volumes of $450 million in the first six months of 2017, which is also too small to register on the chart
So the cleared interest rate swap market continues to grow strongly, with exceptional growth rates at LCH and JSCC, a steady increase at CME, while Eurex and BME are ones to keep an eye on.
Currency and product
Next we examine the cumulative volume in the six months to June 30, 2017 by currency and product for each clearing house.
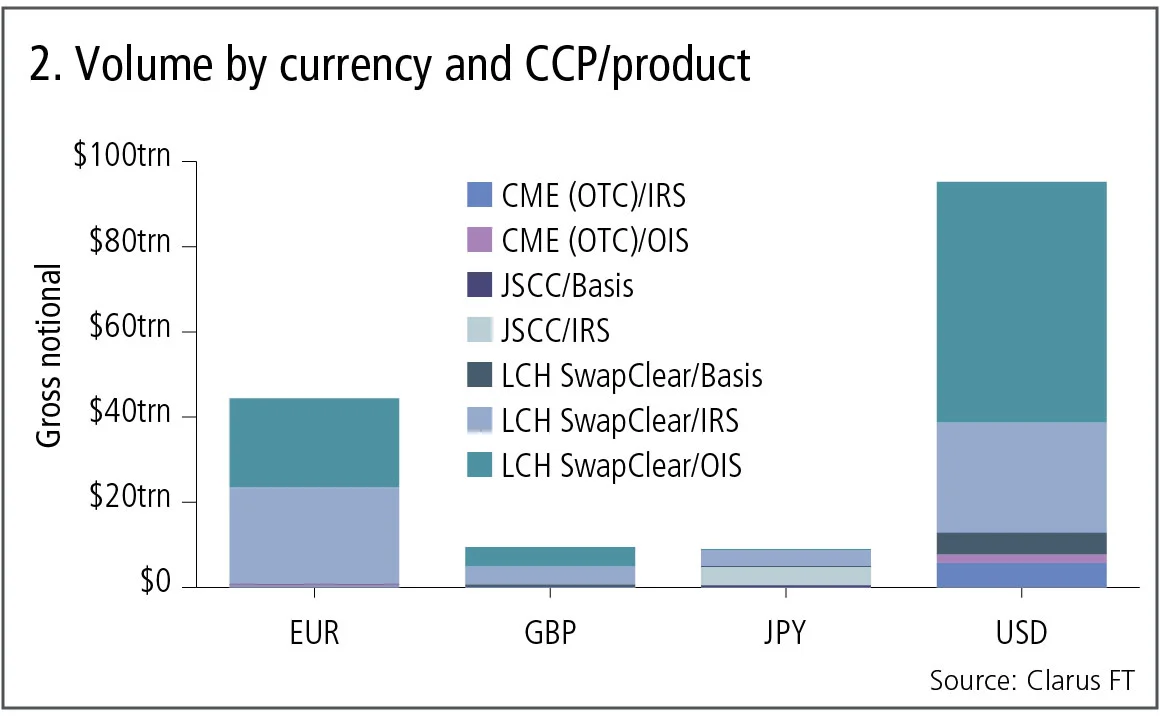
Figure 2 shows:
- US dollar is by far the largest currency with $95 trillion, of which $56 trillion of OIS is at LCH, $26 trillion is interest rate swaps at LCH, $5.7 trillion is interest rate swaps at CME, $5.1 trillion is basis swaps at LCH and $2 trillion is OIS at CME.
- Euro is the next largest currency with $44 trillion, of which $23 trillion is interest rate swaps and $21 trillion is OIS, both at LCH.
- The sterling total is $9.5 trillion, of which $4.6 trillion is OIS and $4.2 trillion is interest rate swaps, both at LCH.
- The yen total is $9.1 trillion, of which $4.3 trillion is interest rate swaps at JSCC and $3.8 trillion is interest rate swaps at LCH.
The key point is that in US dollar OIS gross notional significantly exceeds interest rate swaps and it is similar in euro and sterling. For yen products, though, OIS notional is tiny.
It’s also worth noting that in yen, JSCC has now overtaken LCH, with $4.9 trillion versus $4.2 trillion in gross notional over the period.
Swap execution facilities
Swap execution facilities (Sefs) are trading venues on which a subset of the cleared swaps executed by US-regulated market participants are required to be executed. These Sefs are required to publish daily volumes.
For the same G4-currency swaps, the gross notional reported by Sefs in the six-month period ending June 30, 2017 is $30 trillion, which represents 19% of the global cleared volume of $160 trillion. This is a more-than-decent proportion given that neither US dollar OIS nor forward-starting swaps are mandatory to execute on-Sef, while the bulk of euro, sterling and yen swaps trading takes place in Europe and Japan.
Let’s also look at Sef volume using the per-basis-point interest rate sensitivity – DV01 – by month, categorising it into dealer-to-client (D2C) and dealer-to-dealer (D2D) venues.
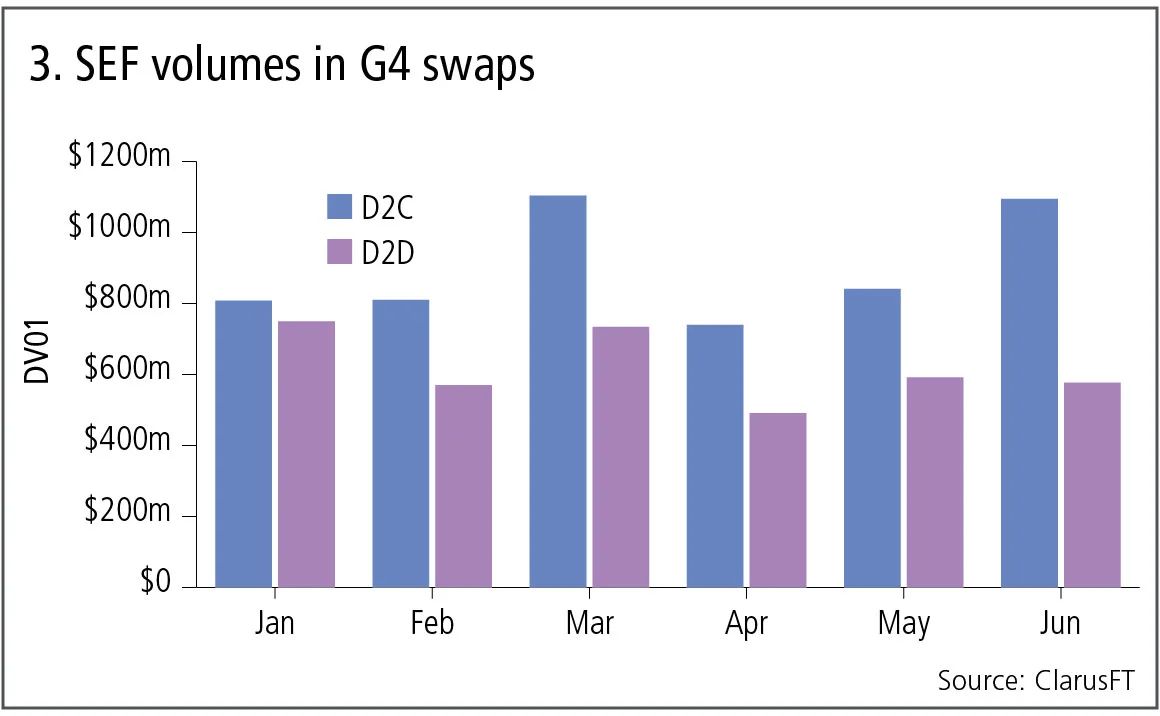
Figure 3 shows:
- D2C volumes, which are from Bloomberg, Tradeweb and TrueEx, are larger each month than D2D volumes – Icap, Tradition, Tullet, BGC, Dealerweb.
- Cumulative D2C volume in the period is $5.4 billion, up 32% from the same six-month period in 2016.
- Cumulative D2D volume in the period is $3.7 billion, up 14% from the same six-month period in 2016.
- D2C venues have grabbed more of the volume, due in part to fee structures, changing market structure and portfolio maintenance functions such as compression list trading.
- The monthly volumes show a growth story for D2C venues, similar in shape to the global volumes in figure 1.
- However for D2D venues, the monthly volumes are a mixed bag, up and down, with no visible trend, definitely not a growth story.
It will be interesting to see how this trend plays out in the reminder of the year – particularly now that the Tullet and Icap merger is complete, and with the possibility of volatility returning to the markets with Federal Reserve rates rises.
Sef compression volume
While the D2C Sefs – Bloomberg, Tradeweb and TrueEx – do not break out their compression volumes from their overall volumes, it is possible to get an idea of the size of this portfolio maintenance activity from US swap data repository (SDR) data.
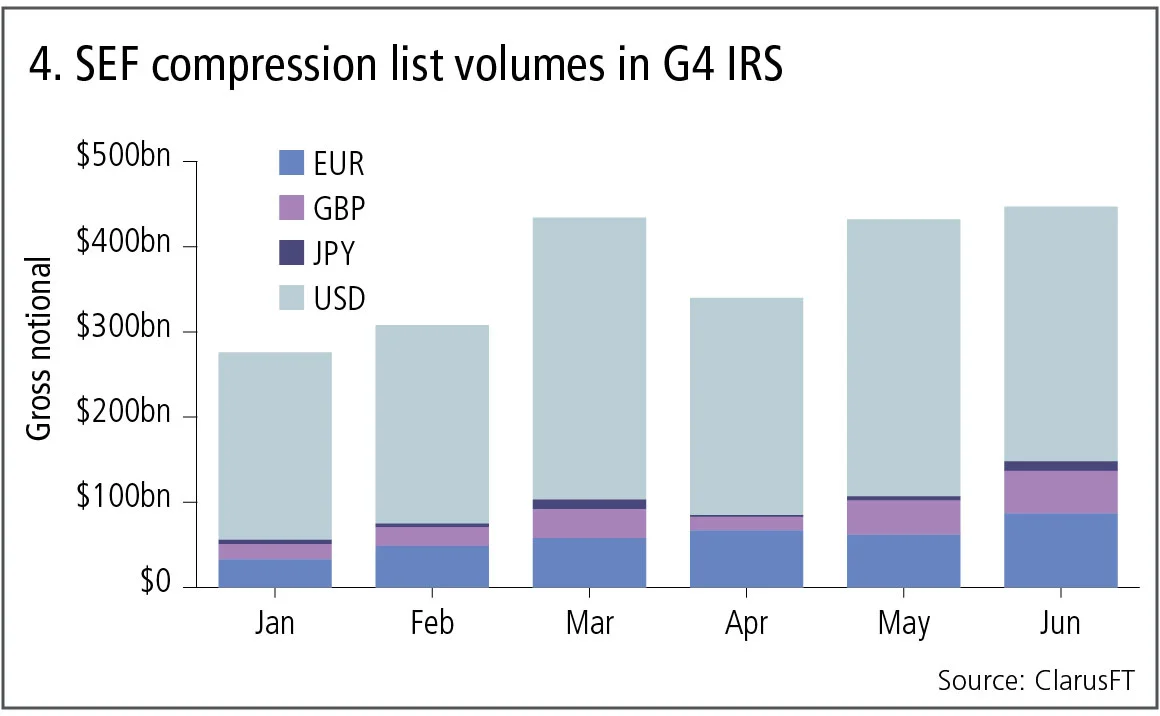
Figure 4 shows:
- Cumulative volume of $2.2 trillion gross notional, a figure that is understated due to US block trade rules. The true notional is likely to be 30% higher, so $3 trillion, which represents 10% of the overall Sef gross notional of $30 trillion in this period.
- The cumulative volume of $2.2 trillion is 68% higher than the corresponding period in 2016, and explains a good part of the growth in Sef volumes.
- US dollar dominates the volumes, though the growth in the other currencies from 2016 has been higher.
We know that Tradeweb has the largest share in compression activity, while TrueEx is also very strong and both are providing a valuable portfolio maintenance activity to the market.
Amir Khwaja is chief executive of Clarus Financial Technology.
About the author
Only users who have a paid subscription or are part of a corporate subscription are able to print or copy content.
To access these options, along with all other subscription benefits, please contact info@risk.net or view our subscription options here: http://subscriptions.risk.net/subscribe
You are currently unable to print this content. Please contact info@risk.net to find out more.
You are currently unable to copy this content. Please contact info@risk.net to find out more.
Copyright Infopro Digital Limited. All rights reserved.
You may share this content using our article tools. Printing this content is for the sole use of the Authorised User (named subscriber), as outlined in our terms and conditions - https://www.infopro-insight.com/terms-conditions/insight-subscriptions/
If you would like to purchase additional rights please email info@risk.net
Copyright Infopro Digital Limited. All rights reserved.
You may share this content using our article tools. Copying this content is for the sole use of the Authorised User (named subscriber), as outlined in our terms and conditions - https://www.infopro-insight.com/terms-conditions/insight-subscriptions/
If you would like to purchase additional rights please email info@risk.net
More on Comment
Op risk data: Tech glitch gives customers unlimited funds
Also: Payback for slow Paycheck Protection payouts; SEC hits out at AI washing. Data by ORX News

Op risk data: Lloyds lurches over £450m motor finance speed bump
Also: JPM trips up on trade surveillance; Reg Best Interest starts to bite. Data by ORX News

Georgios Skoufis on RFRs, convexity adjustments and Sabr
Bloomberg quant discusses his new approach for calculating convexity adjustments for RFR swaps
In a world of uncleared margin rules, Isda Simm adapts and evolves
A look back at progress and challenges one year on from UMR and Phase 6 implementation

Op risk data: Morgan Stanley clocked in block trading shock
Also: HSBC deposit guarantee gaffe; Caixa hack cracked; reg fine insult to cyber crime injury. Data by ORX News

Digging deeper into deep hedging
Dynamic techniques and gen-AI simulated data can push the limits of deep hedging even further, as derivatives guru John Hull and colleagues explain

How AI can give banks an edge in bond trading
Machine learning expert Terry Benzschawel explains that bots are available to help dealers manage inventory and model markets
Op risk data: US piqued by Pictet tax breach
Also: US Bank’s Covid failings; South Korea’s short-selling clampdown. Data by ORX News