
How to gain from risk premia
Brett Humphreys examines historic data for the natural gas market and finds smart traders could make money from hidden risk premia
“The forward curve is the best predictor of spot prices,” is the trader’s advice. But the quant says the current spot price adjusted for seasonality and mean reversion would be the best predictor. Given this somewhat contradictory advice, Joe decides to carry out his own analysis of the problem.
There are problems with both proposed methods. The trader’s advice is based on the assumption that the forward curve is an unbiased predictor of the future spot price. The quant may feel that the forward curve is biased and that therefore the best predictor is derived from the spot price. However, following the quant’s advice might mean ignoring information that is embedded within the forward curve. The best answer is probably a modification: use the forward curve but remove any bias.
The bias that might exist can be called a risk premium. This is a return that the holder of a forward contract expects to earn for holding a risky position. By comparing forward prices with realised spot prices, we can identify biases that might exist in the forward market.
We can take this one step further and compare a forward price with a long time – say, three months – until expiration to one with a shorter time until expiration – for instance, two months. Using this analysis, we can see over what time period the risk premia are realised.
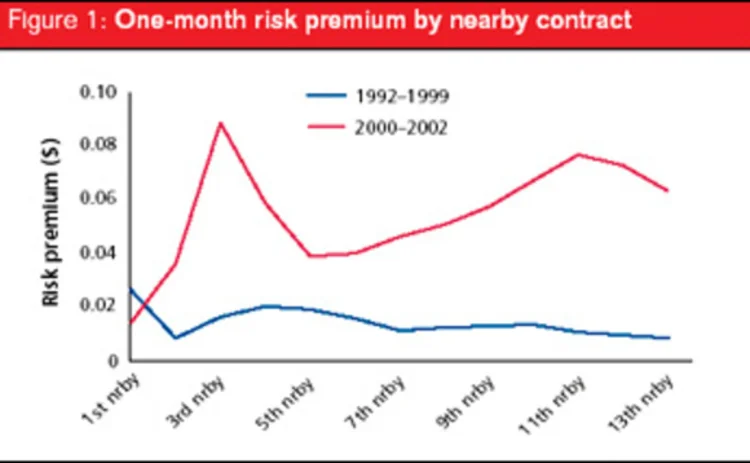
To do this, we examined the behaviour of the New York Mercantile Exchange Henry Hub natural gas futures price from 1992 to 2002 for evidence of risk premia. Specifically, we calculated the dollar price change over a one-month horizon for each contract in the forward curve.
Premium by nearby contract
Initial results indicated that the data set should be split into two periods (1992–1999 and 2000–2002) due to the increased volatility of the gas market over the past two-and-a-half years. Figure 1 shows the results of this analysis by nearby contract. The first nearby contract is the one closest to expiration, the second nearby is second closest, and so on.
While the analysis indicates a large risk premium from 2000–2002, due to the volatility over this time horizon the parameters are not statistically significant. In contrast, the 1992–1999 period has a smaller, less volatile risk premium. Furthermore, the results from 1992–1999 are intuitively appealing. As contracts that are closer to expiration have greater risk, we would expect a greater risk premium. Specifically, from 1992–1999, an investment in natural gas would on average lead to a profit of $0.01 per million British thermal units (mmBtu) per month due to the risk premium, with the premia increasing as the contract approaches expiration.
Premium by month
As an alternative, we can examine the data to determine the risk premium for specific contract months. For this exercise, we examine dollar price changes for specific contract months, such as the January contract, for the twelve months prior to their expiration. The results of this analysis are shown in figure 2.
While we might initially expect to see a higher risk premium during the higher-priced winter months, we instead see significantly higher risk premia for the April and May contracts as well as for the October, November, December and January contracts. The summer and mid-winter months have lower risk premia. These contracts roughly match the ‘shoulder’ months1 of natural gas trading, when there is greatest uncertainty and risk over actual gas consumption.
The volatility risk premium
Our analysis seems to indicate the overall presence of a positive risk premium in gas prices. Standard option pricing models usually make the assumption that the forward price is an unbiased estimator of the spot price. If the option pricing models ignore the risk premia, they may be underpricing some options.
To test this, we evaluated the price of at-the-money call and put options2 one month to expiration. We then calculated the value of the option at expiration. If the option is fairly priced, the value of the option at expiration less the option premium should, on average, be zero. The results indicated that, on average, buying a call option with one month to expiration led to a loss of $0.01/mmBtu and buying a put option led to a loss of $0.02/mmBtu.
These results imply the presence of a different type of risk premium – a volatility risk premium. In this case, the writers of options receive a premium for taking the option risk. This premium is bigger than other risk premia that might exist in the natural gas market.
While the calculated risk premium is small and only marginally significant, smart traders and hedgers use this information when developing their strategies. Traders may want to tilt their strategy to being long – and long the shoulder month contracts in particular – due to the risk premia. We would expect to make a few cents due to the risk premia from such trades. Hedgers, on the other hand, would want to select the hedging strategy where they pay the least risk premia for the protection. Given the risk premia paid to writers of options, hedgers might more actively consider using written options in their hedge strategies.
While the risk premium is not a guaranteed return and there is still a substantial chance of loss, good traders and hedgers will do the most they can to swing the odds in their favour.
Brett Humphreys is a consultant at Risk Capital Management in New York.
e-mail: humphreys@e-rcm.com
Only users who have a paid subscription or are part of a corporate subscription are able to print or copy content.
To access these options, along with all other subscription benefits, please contact info@risk.net or view our subscription options here: http://subscriptions.risk.net/subscribe
You are currently unable to print this content. Please contact info@risk.net to find out more.
You are currently unable to copy this content. Please contact info@risk.net to find out more.
Copyright Infopro Digital Limited. All rights reserved.
You may share this content using our article tools. Printing this content is for the sole use of the Authorised User (named subscriber), as outlined in our terms and conditions - https://www.infopro-insight.com/terms-conditions/insight-subscriptions/
If you would like to purchase additional rights please email info@risk.net
Copyright Infopro Digital Limited. All rights reserved.
You may share this content using our article tools. Copying this content is for the sole use of the Authorised User (named subscriber), as outlined in our terms and conditions - https://www.infopro-insight.com/terms-conditions/insight-subscriptions/
If you would like to purchase additional rights please email info@risk.net
More on Energy
Energy Risk Commodity Rankings 2024: markets buffeted by geopolitics and economic woes
Winners of the 2024 Commodity Rankings steeled clients to navigate competing forces
Chartis Energy50
The latest iteration of Chartis’ Energy50 ranking
Energy trade surveillance solutions 2023: market and vendor landscape
The market for energy trading surveillance solutions, though small, is expanding as specialist vendors emerge, catering to diverse geographies and market specifics. These vendors, which originate from various sectors, contribute further to the market’s…
Achieving net zero with carbon offsets: best practices and what to avoid
A survey by Risk.net and ION Commodities found that firms are wary of using carbon offsets in their net-zero strategies. While this is understandable, given the reputational risk of many offset projects, it is likely to be extremely difficult and more…
Chartis Energy50 2023
The latest iteration of Chartis' Energy50 2023 ranking and report considers the key issues in today’s energy space, and assesses the vendors operating within it
ION Commodities: spotlight on risk management trends
Energy Risk Software Rankings and awards winner’s interview: ION Commodities
Lacima’s models stand the test of major risk events
Lacima’s consistent approach between trading and risk has allowed it to dominate the enterprise risk software analytics and metrics categories for nearly a decade
2021 brings big changes to the carbon market landscape
ZE PowerGroup Inc. explores how newly launched emissions trading systems, recently established task forces, upcoming initiatives and the new US President, Joe Biden, and his administration can further the drive towards tackling the climate crisis
Most read
- Basel Committee reviewing design of liquidity ratios
- SG trader dismissals shine spotlight on intraday limit controls
- Too soon to say good riddance to banks’ public enemy number one

