
Monthly credit data review: PDs imply Brexit stress
Default risk for group of UK corporates has risen 11% over the past year

Those who argued for the UK to remain part of the European Union suffered the pain of losing last year’s referendum, then the indignity of being wrong about the economic impact – the pound collapsed, but economic data was initially robust. Slowly, though, sunshine has been replaced by clouds: rising inflation and sluggish growth in wages is translating into weaker consumer spending.
Growing stresses can be seen in bank assessments of UK corporate default risk. Tracking a fixed sample of 414 companies over the past 12 months shows the average one-year probability of default (PD) has climbed 11.1% – from 72 basis points to 80bp – dropping the group from bb+ to bb (see box: About this data).
The deterioration has been uneven – after the June 2016 low, PDs were higher in July and August, then flat or lower for the three months that followed. This year, each month has been worse than the last. This neatly follows the macro-economic sentiment, but also reflects the microscopic details that make up PD forecasts for each company, at each of the contributing banks. Put simply, it suggests business is getting tougher for some of these firms.
Elsewhere, this month’s selection of data shows a reversal of fortune for companies in the consumer goods and consumer services sectors – both see downgrades heavily outweighing upgrades. It also looks at the credit strength of clearing houses members, finding significant dispersion for European central counterparties (CCPs) in particular. While the membership of top-rated clearing houses have an average rating of a+, the spectrum at the 16 venues covered runs all the way to bbb–.
Global industry trends
Figure 1 shows industry migration data for the most recent published data.
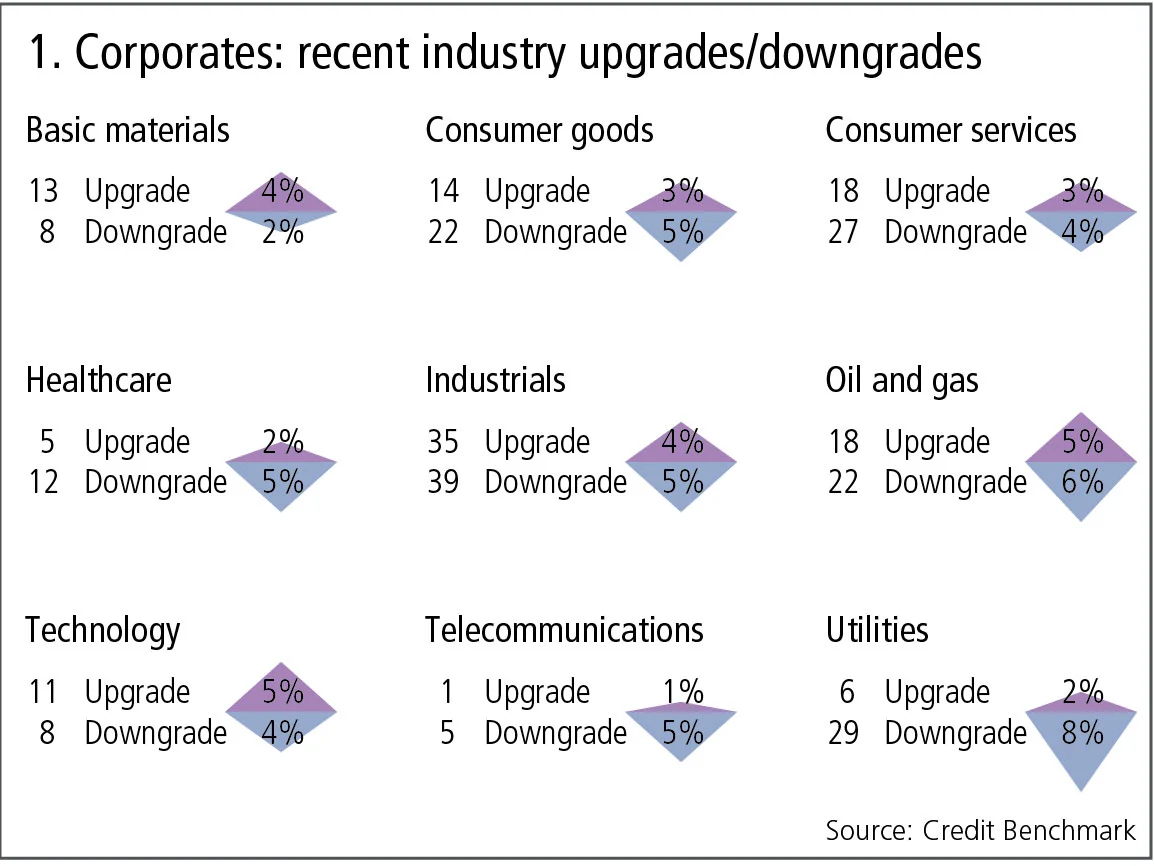
Figure 1 shows:
- Corporate downgrades outnumber upgrades by a significant margin. The most dramatic imbalance is in utilities, with 29 downgrades against six upgrades.
- Consumer goods and consumer services trends have also moved from positive to negative, with 50% more downgrades than upgrades in each industry.
- Upgrades in the basic materials industry continue to outnumber downgrades, but by a narrower margin of 13 to eight. Technology is also showing a slightly positive balance.
UK corporates
In March 2016, the UK sovereign credit consensus was downgraded by banks from aaa to aa+. The one-year anniversary of the country’s referendum on membership of the EU is an opportunity to review the broader credit impact of pre-Brexit uncertainty. Figure 2 shows the credit risk trend for a fixed sample of 414 UK corporates, covering nine sectors; the biggest contributors are industrials, consumer services, consumer goods and utilities. Of the companies, 78% are large; the remainder are small and medium-sized enterprises.
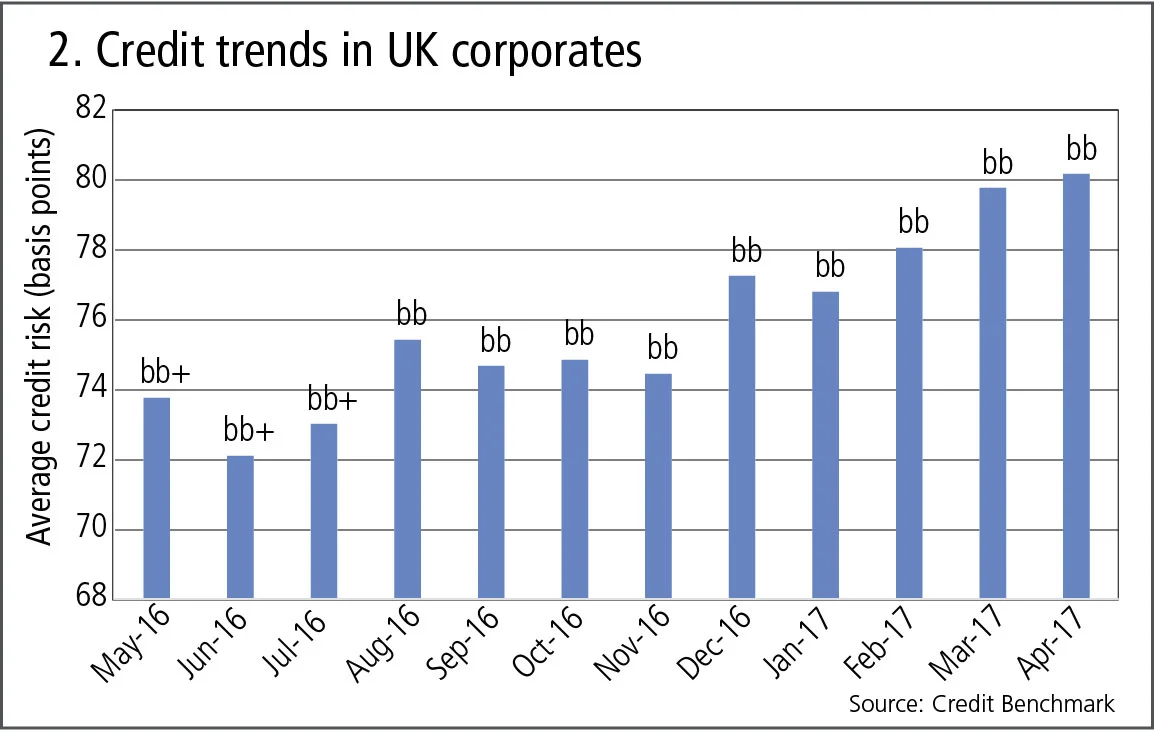
Figure 2 shows:
- Credit risk is measured here by the one-year PD in basis points, and also by the equivalent rating on the 21-category Credit Benchmark Consensus (CBC) scale.
- The credit risk for this sample of companies reached a low in June 2016, the month of the EU referendum.
- At that low point, the average one-year PD was 72bp, equivalent to a CBC of bb+.
- Since then, UK corporate credit risk has steadily risen and the most recent measure shows an average of 80bp, equivalent to a CBC of bb.
Central counterparties
The ongoing debate about the clearing of euro-denominated derivatives has again highlighted the critical financial stability role of CCPs and their members. Regulators have mandated the use of these institutions in an attempt to better control the swaps market’s hidden web of counterparty risks – instead embracing a hub-and-spoke model. This model would be tested in the event of one or more large member firms defaulting.
To get a rough idea of how likely each CCP is to face a default event, figure 3 shows the average credit risk for the members of 10 North American and 16 European CCPs. For each CCP, not all of the members are included in the analysis – only those for which two or more PDs were available have been included.
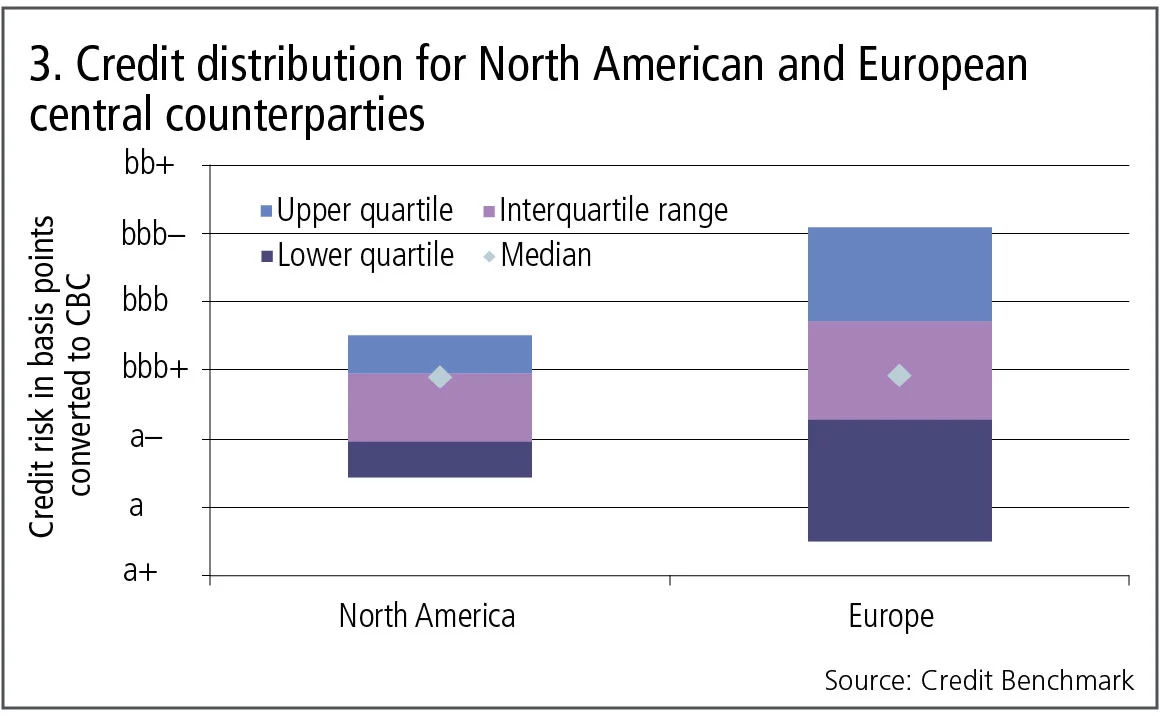
Figure 3 shows:
- The typical credit risk of the membership at North American and European central counterparties is almost identical, with a median CBC of a–.
- For North American CCPs, the interquartile range is almost entirely aligned with the a– category. In Europe, the interquartile range for CCP member credit risk extends well into the bbb+ category. This partly reflects the larger sample but also reflects the specialised or regional nature of some of the European CCPs.
- The full range of member credit risk for North American CCPs is much narrower than that of the European equivalents. Some European CCPs’ members are on average in the a+ credit category, while others are in the bbb– category, which is one notch above the investment-grade threshold. For North American CCPs, the range is between a and bbb+.
Investment funds
Investment fund credit risk is becoming increasingly important due to agency lender disclosure requirements in forthcoming European securities financing rules, due to come into force at the end of 2018. In financing and stock-loan transactions, the agent lender will have to disclose the ultimate beneficial owner on the other side of each transaction. Figure 4 shows the current distribution of credit risks by fund type, across the 21 CBC categories. This data covers 800 mutual funds, 400 pension funds and 500 hedge funds.
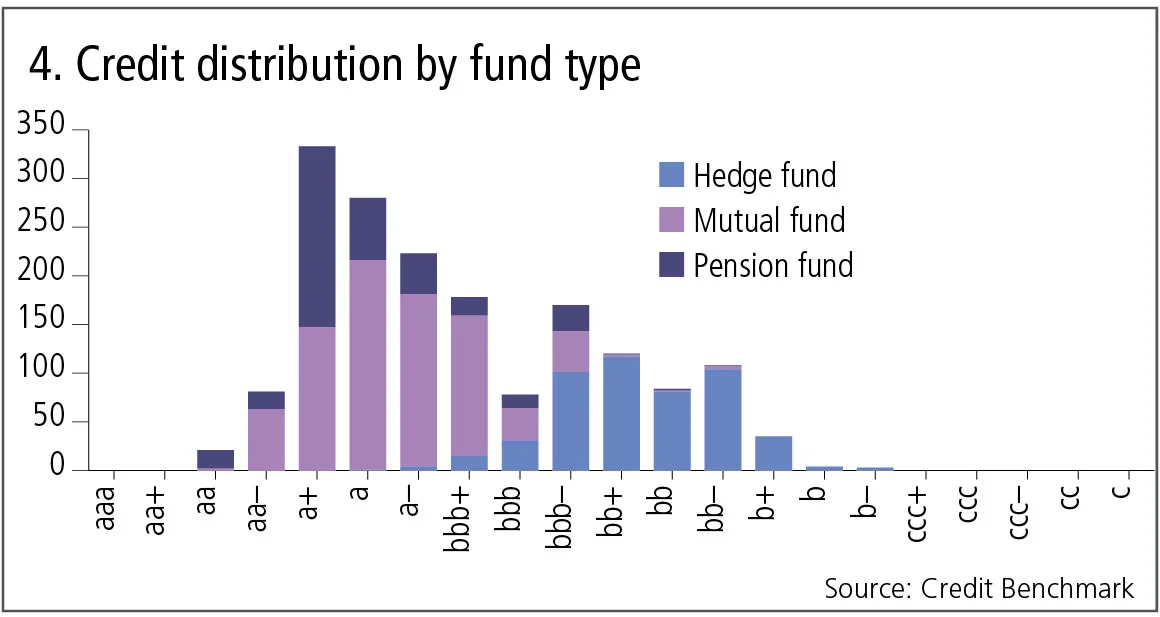
Figure 4 shows:
- The range of credit risks for mutual funds is noticeably high. A very small number of these funds are in the non-investment grade category (bb+ or less), but the majority are in the a+ to bbb+ categories. The mutual fund legal framework – which covers investment restrictions, borrowing limits and audited NAV calculations – has ensured credit defaults have not been an issue. However, a small number of mutual funds do use limited amounts of leverage or invest in illiquid assets, and this may explain the wide range.
- The majority of pension funds are in the a+ category, but the lowest is bb–, which is well below investment grade. Pension fund credit risk will reflect asset/liability status as well as the relative financial strength of the plan sponsor.
- Hedge funds show the widest spread of credit risks, ranging from category a to category b–. The majority are in the bb+ to bb– range, so the majority of hedge funds are viewed as non-investment grade. The category will reflect leverage, strategy and performance.
US states and US state pension funds
Figure 5 shows the distribution of credit risk for US states, and for US state pension funds, based on one-year default probabilities.
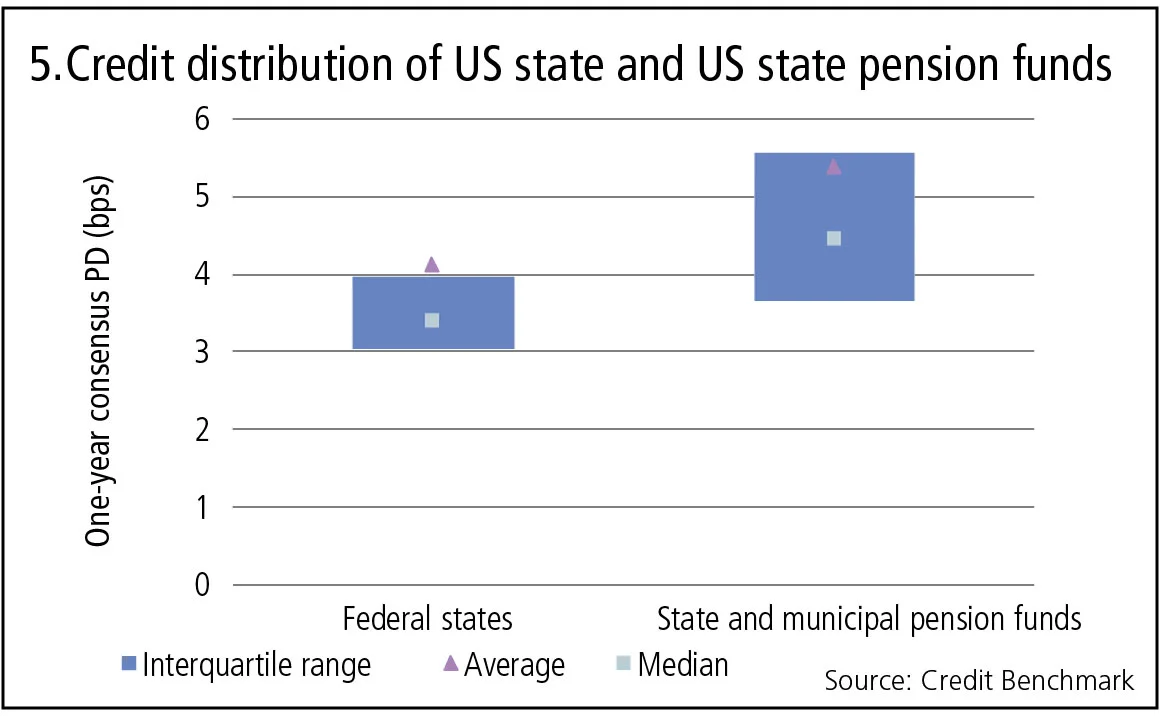
Figure 5 shows:
- The median PD for US federal states is about 3.5bp, equivalent to a CBC of aa–. For state pension funds, the median is about 4.5bp, equivalent to a credit category of a+.
- The interquartile range of federal state credit risk is less than 1bp; for state pension funds it is closer to 2bp.
- While each US state provides an implicit or explicit guarantee for the majority of its employee pension plans, this shows a clear risk premium of about 1bp, reflecting the risk that the sponsoring state will not be able to support every pension fund in the event of a major funding crisis.
About this data
The Credit Benchmark dataset is based on internally modelled credit ratings from a pool of 13 contributor banks. These are mapped into a standardised 21-bucket ratings scale, so downgrades and upgrades can be tracked on a monthly basis. Obligors are only included where ratings have been contributed by at least three different banks, yielding a total dataset of more than 8,000 names, which is growing by 5% per month.
Only users who have a paid subscription or are part of a corporate subscription are able to print or copy content.
To access these options, along with all other subscription benefits, please contact info@risk.net or view our subscription options here: http://subscriptions.risk.net/subscribe
You are currently unable to print this content. Please contact info@risk.net to find out more.
You are currently unable to copy this content. Please contact info@risk.net to find out more.
Copyright Infopro Digital Limited. All rights reserved.
You may share this content using our article tools. Printing this content is for the sole use of the Authorised User (named subscriber), as outlined in our terms and conditions - https://www.infopro-insight.com/terms-conditions/insight-subscriptions/
If you would like to purchase additional rights please email info@risk.net
Copyright Infopro Digital Limited. All rights reserved.
You may share this content using our article tools. Copying this content is for the sole use of the Authorised User (named subscriber), as outlined in our terms and conditions - https://www.infopro-insight.com/terms-conditions/insight-subscriptions/
If you would like to purchase additional rights please email info@risk.net
More on Comment
Op risk data: Tech glitch gives customers unlimited funds
Also: Payback for slow Paycheck Protection payouts; SEC hits out at AI washing. Data by ORX News

Op risk data: Lloyds lurches over £450m motor finance speed bump
Also: JPM trips up on trade surveillance; Reg Best Interest starts to bite. Data by ORX News

Georgios Skoufis on RFRs, convexity adjustments and Sabr
Bloomberg quant discusses his new approach for calculating convexity adjustments for RFR swaps

In a world of uncleared margin rules, Isda Simm adapts and evolves
A look back at progress and challenges one year on from UMR and Phase 6 implementation

Op risk data: Morgan Stanley clocked in block trading shock
Also: HSBC deposit guarantee gaffe; Caixa hack cracked; reg fine insult to cyber crime injury. Data by ORX News

Digging deeper into deep hedging
Dynamic techniques and gen-AI simulated data can push the limits of deep hedging even further, as derivatives guru John Hull and colleagues explain

How AI can give banks an edge in bond trading
Machine learning expert Terry Benzschawel explains that bots are available to help dealers manage inventory and model markets

Op risk data: US piqued by Pictet tax breach
Also: US Bank’s Covid failings; South Korea’s short-selling clampdown. Data by ORX News

Most read
- Top 10 operational risks for 2024
- Top 10 op risks: third parties stoke cyber risk
- Japanese megabanks shun internal models as FRTB bites