Journal of Risk Model Validation
ISSN:
1753-9579 (print)
1753-9587 (online)
Editor-in-chief: Steve Satchell
Model risk tiering: an exploration of industry practices and principles
Nick Kiritz, Miles Ravitz and Mark Levonian
Need to know
- Financial firms tier their models according to risk to support a range of model risk management activities.
- Decision trees and scorecards are the two main approaches to tiering, with each type of tool having advantages and disadvantages.
- Observed industry practice highlights several key principles for effective model risk tiering.
- Design, calibration, implementation, and governance of model risk tiering should reflect those key principles.
Abstract
Model risk management continues to be an important area of risk management across financial services firms. Regulatory expectations for model risk management apply to an expanding number and variety of financial firms. In our conversations with clients, we find that many risk managers are unaware of standard practices in developing and implementing frameworks for model risk management. This paper – based on our experience as consultants, former banking supervisors and leaders of units focused on model risk management – seeks to shed light on one critical area of such frameworks: model risk tiering, or the rating of risk inherent in the use of individual models, which can benefit a firm’s resource allocation and overall risk management capabilities. Although the range of practice in model risk tiering across financial services is broad and varied, our work has revealed a number of insights.
- Most financial firms use explicit procedures and decision tools to assign models to risk tiers.
- Nearly all firms assign models to several risk tiers rather than seeking to rank them individually from high to low.
- Although most firms use model risk-tiering tools, these tools serve primarily to systematize the application of judgment to the risk posed by models rather than to directly quantify risk.
- A set of useful principles regarding the construction of such risk-tiering tools can be gleaned from observing industry practices.
- Tiering tools generally fall into one of two categories – scorecards or decision trees – with scorecard approaches being the more common of the two.
- Tiering tools generally take into account both the risk and the impact of model failure; the building blocks for these two factors include a variety of descriptors regarding the construction and use of each model in the inventory.
- Calibration of model risk-tiering tools is largely judgmental and often depends on whether the firm has a preexisting allocation of models to risk tiers.
- Governance over model risk-tiering tools is an evolving process with rising standards.
Introduction
1 Context
1.1 Model risk
Modeling continues to play an increasing role in financial services. Indeed, as more and more data becomes available and the technology for using data becomes cheaper and more powerful, more sophisticated quantitative modeling and business analytics are spreading across the industry landscape. As modeling processes come to play a larger role in business decisions, the need for model risk management continues to grow. Financial regulators are increasingly recognizing that need, incorporating model risk management requirements into rulemaking across an increasing variety of financial regulations.
Model errors continue to drive unexpected losses. Some of the more spectacular model risk failures have been well documented. High-profile examples include Long-Term Capital Management in 1998, the evident shortcomings due to using Gaussian copulas in the pricing of structured products in the financial crisis, and the AXA Rosenberg loss.
Bulletin 2000-16 from the US Office of the Comptroller of the Currency (2000), which focused on model validation, was the first formal supervisory guidance on model risk for financial firms. Model risk was subsequently addressed at a high level in the Basel capital rules, developed in greater depth by the Committee of European Banking Supervisors in its guidelines on the implementation, validation and assessment of the advanced measurement and internal ratings-based approaches (Committee of European Banking Supervisors 2006), and expanded in the European Union’s Solvency II rules for insurers (European Parliament and Council of the European Union 2009). Globally, the most important collection of supervisory documents on model risk management (MRM) to date is the US regulators’ consistent, but separately issued, Supervisory Guidance on Model Risk Management (Board of Governors of the Federal Reserve System 2011; Office of the Comptroller of the Currency 2011; Federal Deposit Insurance Corporation 2017: collectively known as the US banking agency guidance).
Model risk has been addressed within a number of other supervisory and regulatory documents. These documents include the Capital Requirements Regulation in the EU (European Parliament and Council of the European Union 2013), the Model Risk Management Guidance of the Federal Housing Finance Agency (FHFA; Federal Housing Finance Agency 2013), and the Securities and Exchange Commission’s (SEC’s) Standards for Covered Clearing Agencies (Securities and Exchange Commission 2016) and Nationally Recognized Statistical Rating Organizations (Securities and Exchange Commission 2014). More recently, the Office of the Superintendent of Financial Institutions in Canada released a guideline titled “Enterprise-wide model risk management for deposit-taking institutions” (Office of the Superintendent of Financial Institutions 2017).
1.2 Risk-sensitive model risk management
Sound risk management generally requires the allocation of resources according to risk, with riskier areas receiving relatively more. Although the US banking agency guidance does not explicitly refer to risk-sensitive MRM, it does allow that “the range and rigor of validation activities conducted prior to first use of a model should be in line with the potential risk presented by use of the model”. The guidance also states that, “[a]s is generally the case with other risks, materiality is an important consideration in model risk management”. The FHFA’s guidance (Federal Housing Finance Agency 2013) goes into greater detail in this regard, stating expectations for model risk ranking and suggesting areas of activity in which MRM efforts might vary. These include “[t]he level of prioritization, scope, frequency, and documentation of validation activities”. The statements of principle in these supervisory documents are appropriately viewed as endorsing a risk-sensitive approach to MRM. In practice, risk-sensitive MRM is applied by varying the breadth and depth of activities in a number of areas, including model documentation, model validation and ongoing monitoring.
As the importance of model risk and the supervisory requirements around its governance have increased, financial firms have sought to develop means of effectively allocating resources for MRM. Model inventories may be very extensive. Large and complex firms subject to the US banking agency guidance will likely have several hundred or even thousands of models. Given the number of models in many firms and US supervisory expectations for some level of MRM coverage of all models, effective allocation of MRM resources has become an increasingly pressing issue.11 1 Although the expanded coverage of MRM driven by the US banking agency guidance likely drove the proliferation of model risk-tiering processes across the industry, it had already been enhanced in a number of firms, including Fannie Mae, where one of this paper’s authors developed a risk-tiering scorecard to rationalize the massive model validation effort undertaken to support the financial restatement in 2005–6. For example, a model’s risk level might determine the breadth, depth, priority and frequency of validation activities, such as review of documentation, developmental data and/or performance testing. Similarly, a model’s risk level might impact the extent of model validation testing, such as backtesting, benchmarking, sensitivity testing, stability testing or others. Model risk may also influence the nature of model implementation testing, such as system implementation testing, or the extent of ongoing monitoring activities, such as process verification.
Firms that fail to differentiate models according to risk are unable to implement risk-sensitive MRM. For instance, we have observed an institution with a large model validation unit fail to appropriately implement risk-sensitive model governance for model validation. The validation function found itself overwhelmed by validation exercises conducted entirely to a single high standard. This led to delayed validations that significantly impeded business operations. The model risk unit of this firm also sought to exclude all nonstatistical models from its MRM framework in an effort to address the overwhelming workload. This exclusion led to significant supervisory issues around judgment-based models used for anti-money laundering (AML) and stress testing purposes. This one-size-fits-all approach may also have led to significant numbers of unreported low risk models, subjecting the firm to additional risk and regulatory exposure. Anecdotal evidence suggests that other firms have faced the opposite problem, failing to rigorously validate simple but highly risky models, resulting in severe regulatory issues and reputational events.
1.3 Model risk-tiering tools
In an ideal world, the risk posed by each model would be measured and quantified on a consistent basis. The cost of that risk would be characterized, and risk-mitigating resources would be allocated according to their highest value. In addition to resource allocation, such quantification could help characterize the amount and concentration of model risk within the firm as well as allow transparent reporting of model risk exposure to senior management. The results reported could conceivably be used to create a capital reserve, or buffer, for model risk.
In practice, initiatives to develop approaches for quantifying model risk that can be applied consistently across a model inventory are ongoing and at various stages of maturity. Model risk managers generally use less formal processes – model risk-tiering methods of various types that group models into broad risk groups or tiers but do not further differentiate risk within each tier – to stratify models by risk in order to meet the needs of risk-sensitive model governance frameworks. These model risk-tiering tools implement subjectively derived methodologies that maximize the use of objective data inputs while relying on expert judgment to set at least some input values as well as parameterize the tools. This largely heuristic approach has the advantage of being tractable: the tools can be built and implemented using commonly available data. This has allowed firms to develop and implement simple and transparent approaches to assigning models to broad tiers (that is, to conduct model risk tiering) according to formally applied heuristics.
2 Literature
Little academic, technical or regulatory literature has attempted to address the process of tiering the contents of a model inventory by the risk posed to an organization. Although model risk tiering was implemented by some banks after the release of OCC 2000-16 (or even before), neither that bulletin nor the subsequent US banking agency guidance explicitly addresses model risk tiering. In contrast, the FHFA’s guidance (Federal Housing Finance Agency 2013) explicitly discusses risk ranking: “Policies and procedures should provide clear guidelines for developing model classifications or risk rankings. A model’s complexity, business impact and the extensiveness of use generally determine its risk ranking or classification. In large, complex enterprises, the model risk management group and internal audit should harmonize their model risk rankings to achieve consistency.”
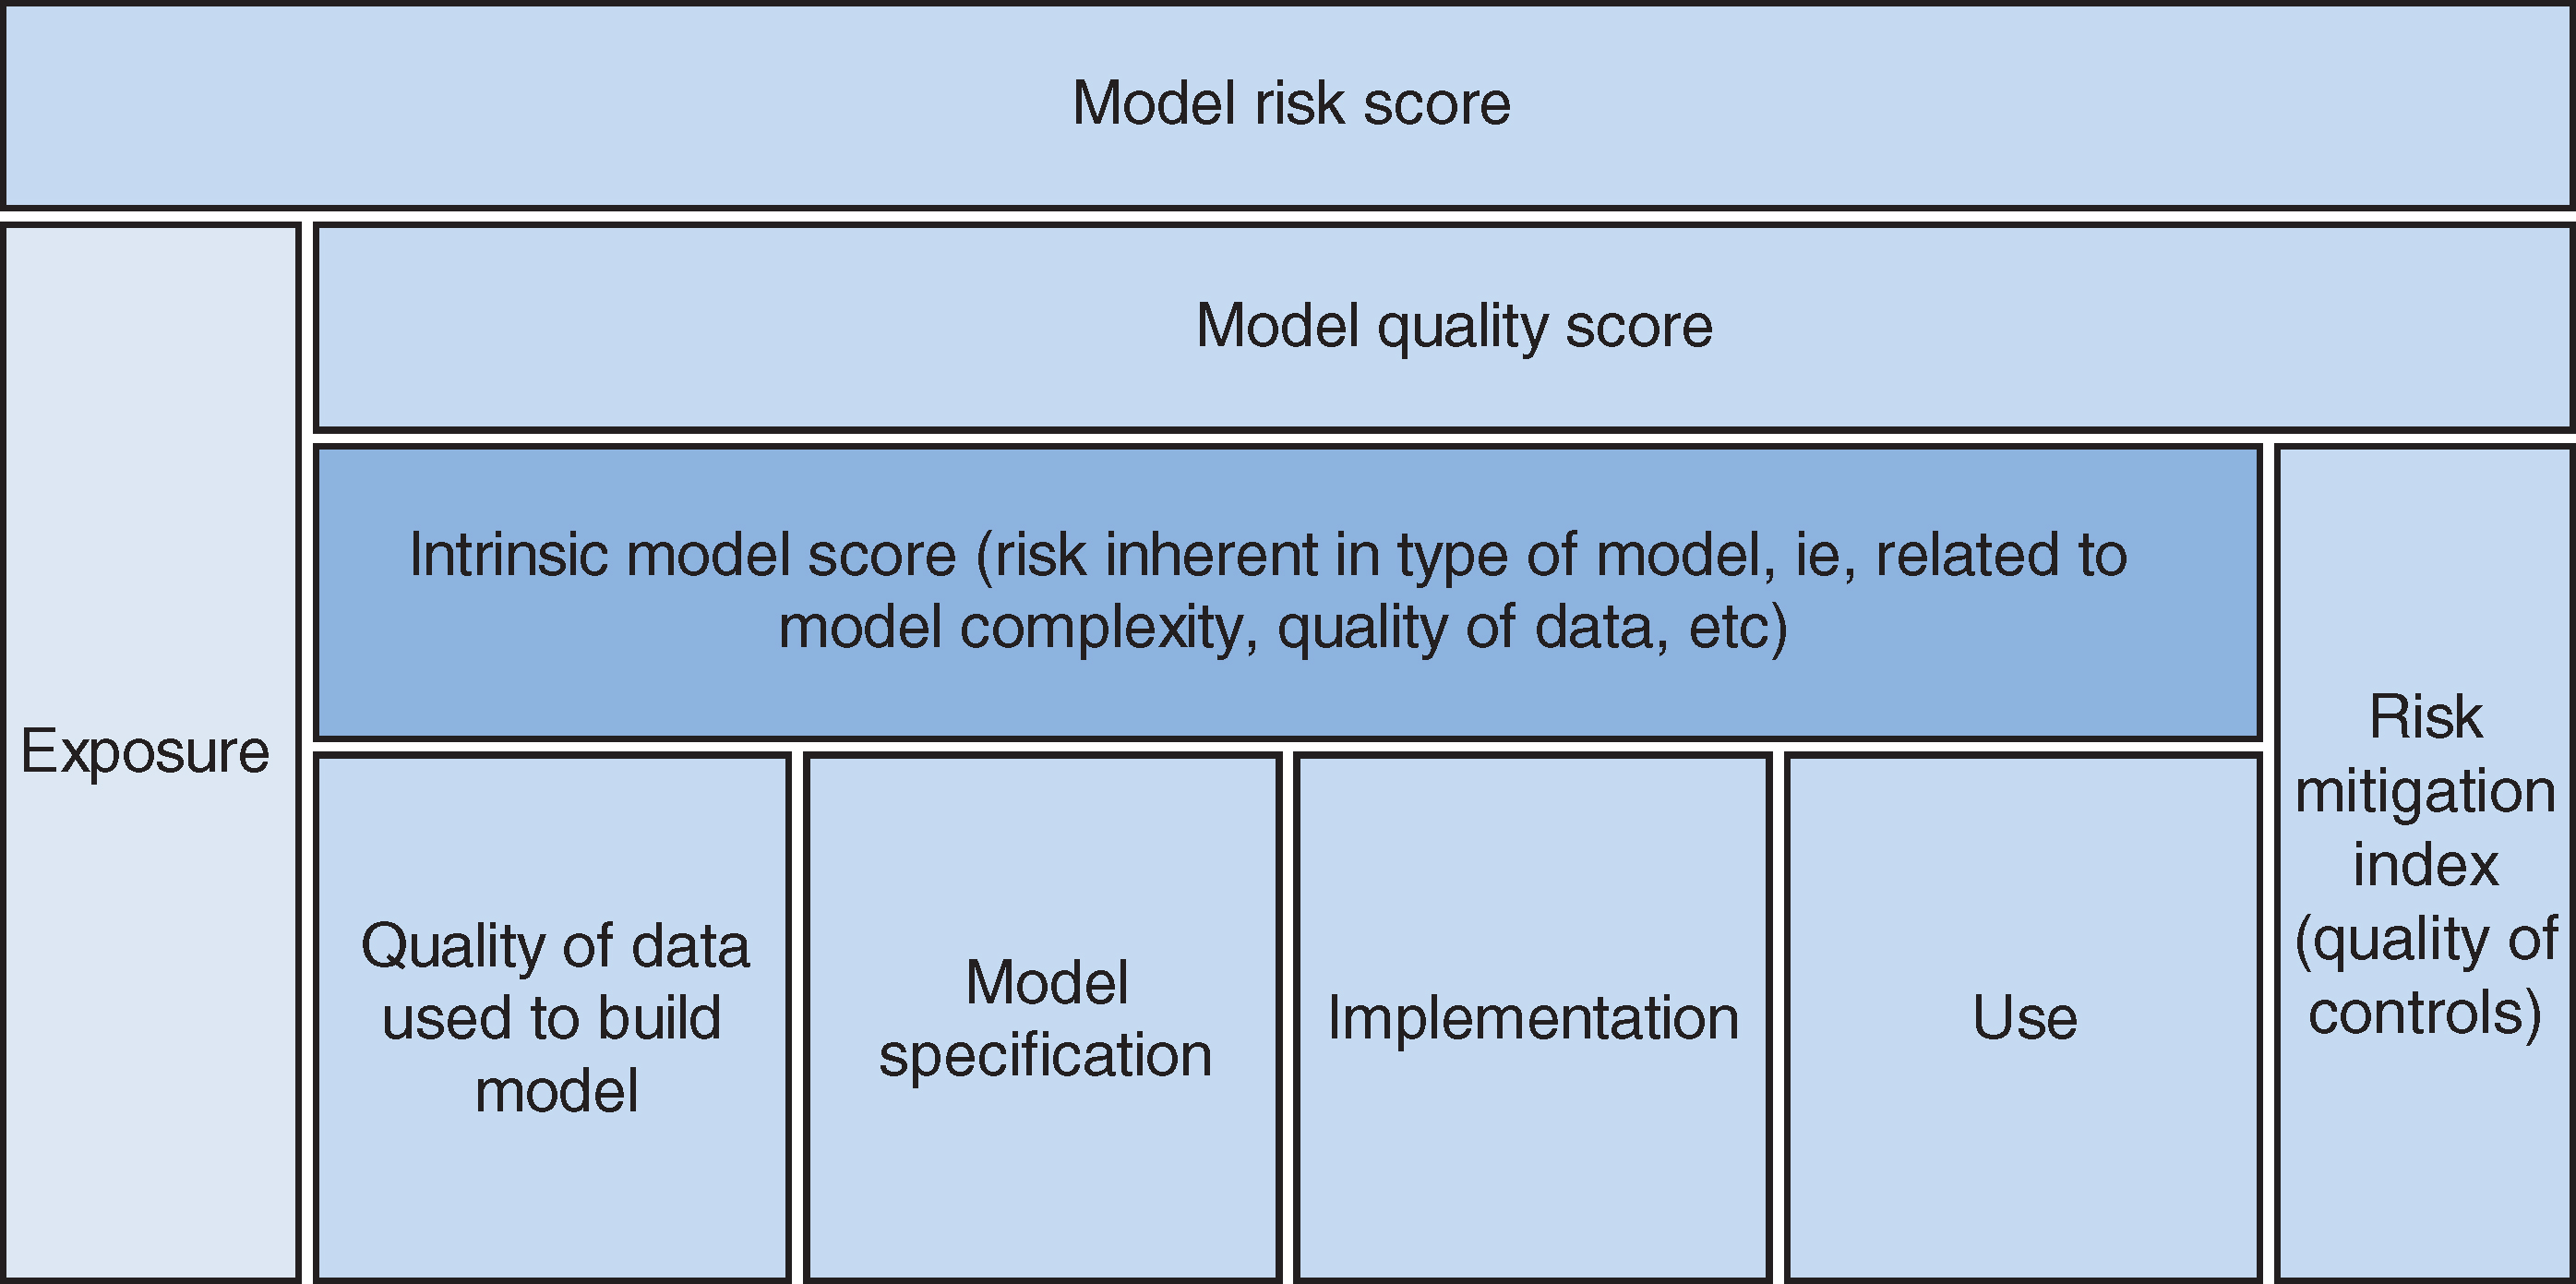
Outside of the financial supervisory community, a few authors have attempted to address the need to create model risk metrics, both to facilitate compliance with supervisory expectations and to establish capital reserves against model failure. In the process, they have addressed model risk-rating approaches. For example, Mankotia and Joshi (2013) propose a decision tree for assigning models to risk tiers (discussed further in Section 4.1).22 2 Mankotia and Joshi (2013) point out that “model mechanics and [measuring risk for] specific types of models have garnered most of the industry’s attention”. They are unable to find “any existing model risk measurement methodologies that can be applied to a broad range of models or that are comprehensive in nature”. Keenan (2015) similarly addresses model risk ranking, although in the context of a broader discussion of modeling and model risk measurement. While his goal is clearly stated as risk quantification, Keenan maintains that “the first order goal of the framework is rank ordering of models by risk”. Although Keenan’s objective is to build a “model risk score” (MRS) to rank-order individual models rather than just assign them to risk tiers, his approach could be used for tier assignment as well. Keenan first proposes to build an “intrinsic model risk score” that combines measures of the risk of technical model failure with measures of operational risk, and with a “nesting penalty” that penalizes models that use other models’ outputs as input components. The intrinsic model risk score is added to a “risk mitigation index”, which is meant to reflect the quality of controls applied to the model in order to yield a “model quality score”. This score is, in turn, added to an exposure measure to yield the MRS. Keenan uses Figure 1 to illustrate his approach.
Industry surveys provide additional public information about current practices in model risk tiering. As an example, the American Bankers Association has published multiple surveys on MRM in cooperation with consulting firms, the most recent of which was released in October 2017 (American Bankers Association 2017). Useful information that may be found in industry surveys includes the types of criteria used in risk-tiering tools, areas with responsibility for model risk tiering and the aspects of MRM that commonly vary by model risk tier.
3 Principles of model risk tiering
Through our work in this area, we have identified a number of basic principles that successful practitioners generally follow when developing and implementing model risk-tiering tools:
- •
avoid false precision by emphasizing risk-tier assignments rather than intermediate outputs such as scores that could be interpreted as more granular risk metrics;
- •
accept the necessity of a significant role for expert judgment and heuristics;
- •
make the process of risk-tiering assignment transparent;
- •
avoid unnecessary complexity to ensure that the tiering process – and the data and tools that support it – is tractable;
- •
focus on inherent rather than residual model risk;
- •
tier models in relative terms, not on an absolute scale;
- •
tier models relative to the rest of the firm-wide inventory, not relative to smaller business or functional areas, to promote consistency in the tiering process across the entire model inventory within the organization;
- •
aim for a reasonable distribution of model assignments across risk tiers; and
- •
ensure tier assignments are relatively stable and predictable.

Most of these principles stem from the quantitative challenges inherent in the process of assessing model risk and the critical role that such assessment plays in risk-sensitive MRM frameworks. Model risk-tier assignments drive the frequency and intensity of many activities. For that reason, a model risk-tiering tool must be widely accepted and understood. Model risk managers use model risk tiers to schedule validation activities and determine their scope. Model owners use model risk tiers to help inform the model approval process. Senior management relies upon model risk tiers to receive clear and concise model risk reporting. Therefore, model risk-tiering tools must be simple to use and logical for both technical and nontechnical audiences. Any criteria underlying the risk-tiering system should be lucid and any calibrations intuitive. A firm-wide awareness of any model risk-tiering tools in use encourages a strong risk culture and supports the consistent assignment and interpretation of model risk tiers.
The remainder of this section discusses these principles in more detail.
3.1 Risk tiering versus risk ranking
Few practitioners rank models top to bottom by risk with each model being assigned a unique rank number. Instead, for a variety of reasons – including tractability – model risk ranking at most firms has evolved into a process of assigning models to a small number of risk levels or tiers (ie, three or perhaps four tiers). Risk tiering requires less precision than model-by-model risk ranking, and risk-tier assignments are more stable, changing primarily in response to material changes in risk. In addition, there are not many decisions about risk management that would be improved in a substantial way by a more granular approach to model risk ranking. Current practice is to vary MRM requirements according to risk-tier assignment, with some requirements added as needed for particular models or model-use situations. An appropriately calibrated model risk-tiering tool serves risk managers better than a framework based on a granular risk ranking. Attempts at excessive precision in measuring model risk add complexity but, in practice, bring little benefit.
3.2 Expert judgment
Processes related to quantitative modeling almost always require at least some discretion on the part of experts, a fact that can be observed through each stage of a model’s life cycle. Similarly, when firms assess relative risks posed by specific models as part of the MRM process, an element of expert judgment is required. Recognizing this fact, management or other expert judgment generally plays at least some role in processes that assign models to risk tiers. Rather than being based entirely on the statistical fitting of models to data, the design of these tools relies upon the qualitative selection of risk drivers and the definition of quantitative boundaries associated with their use.
3.3 Transparent
Although expert judgment necessarily plays an important role in most cases, practitioners also try to use objectively measurable inputs wherever practicable in order to enhance transparency and consistent application. Having the process be transparent within an organization is important, not least because it increases organizational acceptance of the risk-tiering framework. Transparency also reduces uncertainty about model tier assignments, making it easier for model owners and developers to orient their development and documentation efforts toward meeting the standard required by the risk tier to which they expect their models to be assigned. However, some important indicators of model risk, such as model complexity, are exceedingly difficult to measure objectively. Developers of risk-tiering tools must balance the goal of transparency with that of incorporating all significant model risk drivers, since some risk drivers will likely be judgmental.
In order to establish transparency in the development of model risk-tiering tools, developers often solicit input from significant groups of model owners, developers and users, as well as from senior management. In addition to fostering transparency, such an open development process also serves to enhance the organizational legitimacy of the resulting risk tiers as well as to promote consistency in model risk-tier assignments across the organization.
Most firms delegate development and implementation of the risk-tiering methodology to the MRM group, with the head of MRM retaining the authority to override the results of the framework should they appear inappropriate for certain models. Some policies only give the head of MRM the authority to move individual models to a higher (but not a lower) risk tier than that resulting from the risk-tiering tool.
3.4 Tractable
Model risk-tiering tools should be tractable, that is, easily managed and adjusted. Significant factors that affect tractability include the ease or difficulty of obtaining or generating data on the model properties used for risk tiering; the simplicity and flexibility of the risk-tiering process and any internal calculations it uses; and the ease with which the tool can be tuned to bring results more closely in-line with the expert judgment on which the tiering relies. The ability to modify the tool to reflect expert judgment is generally more important than, for example, incorporating complex processes for inputs or rankings in a quest for precision. More tractable tools also tend to be more transparent, so the principles of tractability and transparency reinforce one another.
3.5 Inherent risk
As in other areas of risk assessment, metrics for model risk can measure inherent risk or residual risk.33 3 The Committee of Sponsoring Organizations of the Treadway Commission (2004) states: “Inherent risk is the risk to an entity in the absence of any actions management might take to alter either the risk’s likelihood or impact. Residual risk is the risk that remains after management’s response to the risk. Risk assessment is applied first to inherent risks. Once risk responses have been developed, management then considers residual risk.” In the area of model risk measurement, residual risk might be the focus of a model risk charge, capital charge or haircut. A few firms have implemented a scorecard factor to capture out-of-date or absent model validations or unremediated model issues, both of which are closely related to residual model risk.
However, in practice, most risk-tiering methodologies focus on inherent risk rather than residual risk. Residual model risk takes into account the impact of risk-governance activities. If the primary goal of model risk-tiering tools is to support risk-sensitive model governance, using factors related to the governance of individual models can become circular, with a low level of governance resulting in a model being assigned to a higher risk tier, thereby requiring a higher level of oversight, which could cause a lower risk-tier assignment on the next review (and long-term instability in the tier assignment). In addition, if tier assignment depends on the assessment of residual risk, it will be nearly impossible to compare the risk posed by a reviewed model to an unvalidated model with unknown issues. Tiering that is independent of the results of risk management activities like validation – that is, based on inherent risk rather than residual risk – is better able to treat validated and unvalidated models equally.44 4 This may be particularly important when model risk-tiering systems are first implemented. Many firms first implement a risk-tiering system while working through a model backlog, and the initial model inventory may include many unvalidated models. This creates significant challenges for approaches that include validation results in risk-tier assignments, as the vast majority of models may lack necessary data; Keenan’s (2015) proposed framework, for instance, places critical reliance on model validation and ongoing monitoring results. Inherent risk does not refer to the risk inherent in the model alone. Model risk depends on how a model is used for business decisions. The US banking agency guidance is clear when it defines model risk as “the potential for adverse consequences from decisions based on incorrect or misused model outputs and reports”.55 5 We note, however, that this definition of use can cause some confusion where firm models are used to provide financial advice to firm clients or made available for public use. While firms may not base their own business decisions on these models, their clients or the general public might. Failure to reasonably control such risk may be viewed by regulators such as the SEC as failures in fiduciary duty and result in financial penalties and reputational harm. Thus, inherent model risk must refer to the risk inherent in a model’s use or uses. In practice, many ranking tools put a higher weight on aspects of a model’s use than on those intrinsic to the model’s design. Any reference to a model’s inherent risk or risk tier should be interpreted as a reference to the risk of the model and its associated uses, and not to the intrinsic riskiness of the model itself.
3.6 Relative risk
Measures of risk can be either relative or absolute. Model risk tiering generally reflects an assessment of the risks posed by one model’s use compared with the risks posed by other models in the inventory. The metric produced thus represents relative, not absolute, risk. Moreover, that risk is relative to other models in that specific firm’s inventory, and not relative to the models in use at other firms. This has implications for the definitions of risk-tiering factors and any weights placed on them. For example, an exposure threshold for a regional bank with USD1 billion in assets will almost certainly differ from that used by a systemically important bank with USD1 trillion in assets; if not, then one firm would end up with a much higher proportion of high-risk-tier models than the other. The differences in size and complexity between firms are addressed by differences in the MRM frameworks, which typically dictate more robust MRM activities at each tier for larger and more complex firms than for smaller, simpler ones.
3.7 Firm-wide consistency
The coverage of the relative ranking process should be the same as that of the firm’s MRM framework. In other words, each model should be ranked relative to all other models subject to the same framework, which usually means the entire enterprise. This facilitates consistent risk-sensitive model governance across the firm. While most firms appear to follow this principle (generally using a single framework, inventory and tiering process across the enterprise), a few may have developed separate risk-tiering tools or calibrations at the business level. This approach could create problems insofar as risk management resources may be misallocated to business units with model inventories that significantly differ from those for which the framework was developed.
For very large, global firms, establishing a firm-wide relative-risk-tiering process may present additional challenges. For instance, a central MRM function at a firm with a very large number of models and businesses may find it difficult or impossible to assess the full inventory well enough to detect material inconsistencies in the rank-ordering results generated by the tiering process. Regulatory challenges may arise for companies operating in multiple jurisdictions. For instance, if a bank’s operations in a foreign country are smaller or less complicated relative to those in its home country, the distribution across risk tiers of models used in the foreign country may be perceived by a foreign regulator as excessively skewed toward the lower risk tiers. Such complications, while tractable, are beyond the scope of this paper.
3.8 Reasonable distribution
While the boundaries between risk tiers, and thus the distribution of models across risk tiers, may emerge naturally from observations of model profiles, the initial application of a model-tiering tool may produce an unreasonable distribution of models across risk tiers.66 6 The terms “model profile” and “model profile elements” refer to data about a model and exclude data used in the development or operation of the model. In practice, a commonly encountered issue is an excessive concentration of models in the highest risk tier. While this is not necessarily an incorrect outcome, such concentrations raise natural questions about the design and calibration of the framework. Since the tool is meant to produce a relative risk tiering of models to support risk-sensitive model governance, such clustering may suggest weaknesses in the tool’s ability to discriminate between models presenting different levels of inherent risk. In that case, the tool may not be fulfilling its purpose and could require further refinement.
For a number of reasons, the distribution of models across risk tiers will vary widely between firms. Commonly observed practices within the banking industry suggest a few guiding rules of thumb. In a typical system with three or four tiers, any risk tier containing fewer than about 10% of the total number of models in the inventory is probably too narrowly defined to be useful. Similarly, for any of the higher risk tiers, any tier containing more than about 30–40% of the total number of models is likely too broadly defined to provide the degree of risk differentiation needed for effective MRM. However, since the distribution of models across tiers is set arbitrarily by the construction of the tool, tool developers must consider the resulting distribution of models across risk tiers as part of the tool’s calibration.
3.9 Stable and predictable
Firms look for model risk tiering that is both stable and predictable. Given the extent to which risk-tier assignments may drive model development and validation activities, model owners and developers will frequently request a determination of a proposed model’s risk-tier assignment before or during the development process so that development activities can be tailored to meet the relevant expectations. With an established process, indicative risk tiers can be quite easy to produce. Challenges may arise if the model profile changes once the model is made available for use, particularly if users embrace a model more or less enthusiastically than expected, or if the volume of business at which the model is directed changes substantially within a short time. More problematic predictability issues may stem from disagreements or miscommunication between the model owner and the MRM team regarding judgmental model profile elements needed by the tiering tool. For less established processes, changes made to the tiering tool during model development may drive changes in models’ ultimate risk-tier assignments.
For models that are in use, instability in risk tiers can be even more problematic. Reassigning a model to a higher risk tier may require significant incremental work on the part of model owners, developers and risk managers, while reassigning a model to a lower risk tier may be perceived as reducing the value of similar work already completed. A process that results in frequent revisions to tier assignments after model implementation can significantly undercut internal acceptance of the entire model governance framework.
A desire for stability in tier assignments does not override all other considerations. The risk tiers assigned to models can, and in some cases should, change over time if new information about model risk comes to light, or if a firm identifies a need to revise the MRM framework. The assignment of a model to a different risk tier can be caused by changes to thresholds or other aspects of the model-tiering tool, or by changes in the model profile elements utilized by the tool. This latter change may be caused by the discovery of additional uses, the correction of data errors or the reevaluation resulting in changes to subjective elements of the model profile.
Firms generally find that the stability and predictability of model risk tiering increases over time as staff gain more experience with a given tool and its inputs, and as awareness of the tool spreads within the firm. The key to establishing a stable and predictable model risk-tiering tool appears to be a methodical development process that provides maximum transparency regarding both the tool’s methodology and its results to all stakeholders as development progresses.
4 Observed methodologies
We observe a wide range of risk-tiering methodologies in practice. However, they largely fall into two broad classes. Most firms opt for some variation of a scorecard. A few use a decision tree approach.
4.1 Decision trees
A few firms have elected to implement a model risk tree (MRT) approach like that described in Mankotia and Joshi (2013), illustrated in Figure 2.

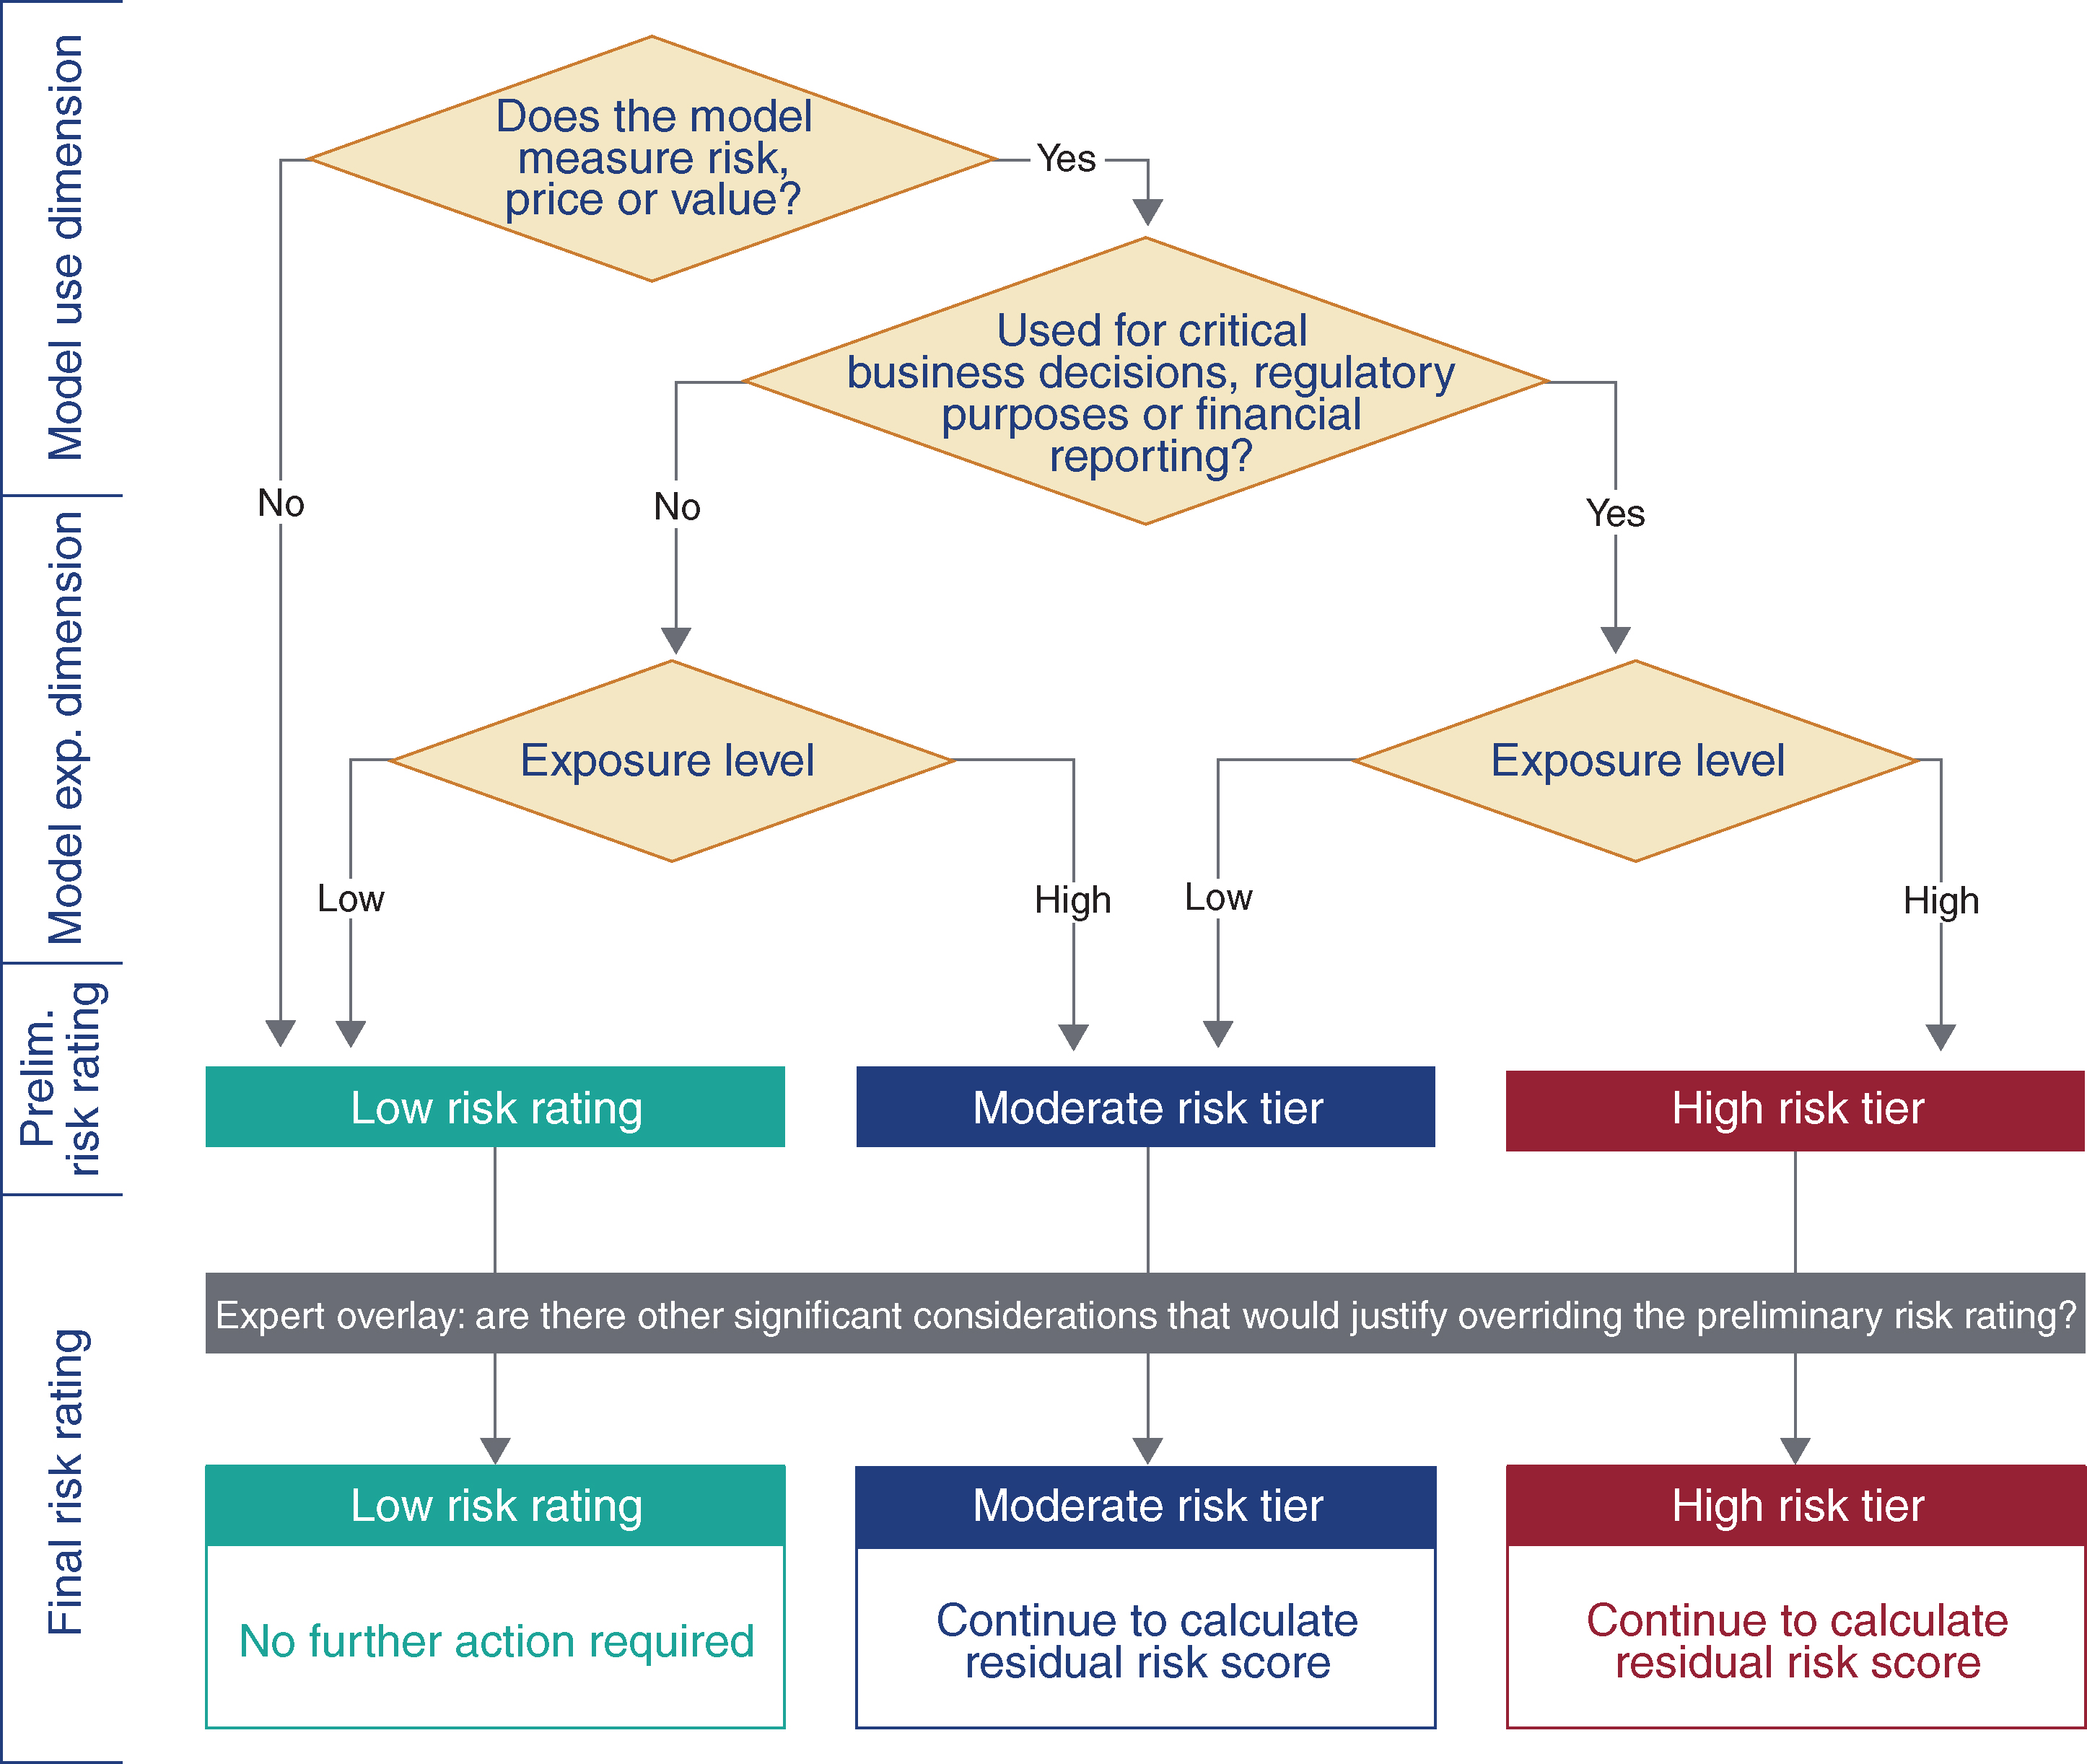
Simple MRTs such as this one have the advantage of being easy to understand and transparent. In addition, since they do not produce a granular metric, MRTs are unlikely to convey false precision.
This MRT evaluates the model-use dimension with a two-step process before using a notional exposure threshold to make the final assignment. The use dimension first evaluates whether the model measures risk, price or value – an indicator of the materiality of the model’s domain coverage – with a “no” answer automatically resulting in assignment to a low risk tier, while a “yes” moves the evaluation to the next stage. The second stage of the use dimension evaluates whether the model is used in critical decision making or for regulatory or financial reporting. If so, the model is assigned to the high or moderate risk tier, depending on notional exposure addressed by the model relative to a threshold; if not, the model is assigned to the low or moderate risk tier, again depending on notional exposure relative to the threshold. Later boxes rely on judgment regarding the model’s use and exposure level.
As may be evident from the description, this particular decision tree implementation relies heavily on judgmental inputs. It also relies on binary categorical outcomes and therefore does not allow for more than two answers to any question. This is a common approach to decision tree construction both because multiple categorical outcomes (also known as multiple-level categorical variables) can make decision trees very complicated very quickly – and thus difficult to represent and interpret – and because decision trees may become biased with the inclusion of categorical variables with multiple levels (see Deng et al 2011). Visual representation of decision trees can get even more challenging when multiple-level categorical variables and larger numbers of variables are combined.
In practice, in part due to these challenges, designers tend to keep decision trees simpler than scorecards, even though very complex decision tree models have been developed in various disciplines (see, for example, Lewis 2000). While simple is good, oversimplification can create problems for a tiering process. For instance, in the uppermost diamond of Figure 2, the use of a binary variable identifying whether the model measures risk, price or value may create a very strong binary effect, where a more continuous multiple-level categorical variable would give a more nuanced result that aligns better with expert judgment. In practice, such binary materiality variables can create tools that inadequately differentiate model materiality and result in a concentration of model assignments in higher tiers (clustering).
4.2 Scorecards
Figure 3 shows a sample model risk scorecard (MRS). This scorecard uses a factor/component approach with four factors. Some factors are represented by single components while others utilize multiple components. The “value range” column gives potential values for the model inputs, some of which may be directly sourced from the model profile while others may require preprocessing to convert variables with continuous or widely varying values into more limited categorical variables. Examples of variables that must be converted to categorical types include estimated dollar exposure, number of users and number of input variables. The “weight” column gives the percentage weight of each factor (in yellow) in the final score, along with the weight of each component of the factor value (in pink). In addition to the four factors, this MRS includes two adjustments: a “capital stress testing” indicator, which can push a model into tier 1 regardless of its score on other factors, and an MRM adjustment, a score override allowing the head of the MRM group to add up to 50% of the total possible value to the base metric. The MRS produces a final risk score to drive the risk-tier assignment, as seen at the bottom of Figure 3. The process of setting preprocessing thresholds, component and factor weights, and total risk-score tier-assignment thresholds is addressed below in our discussion of calibration.

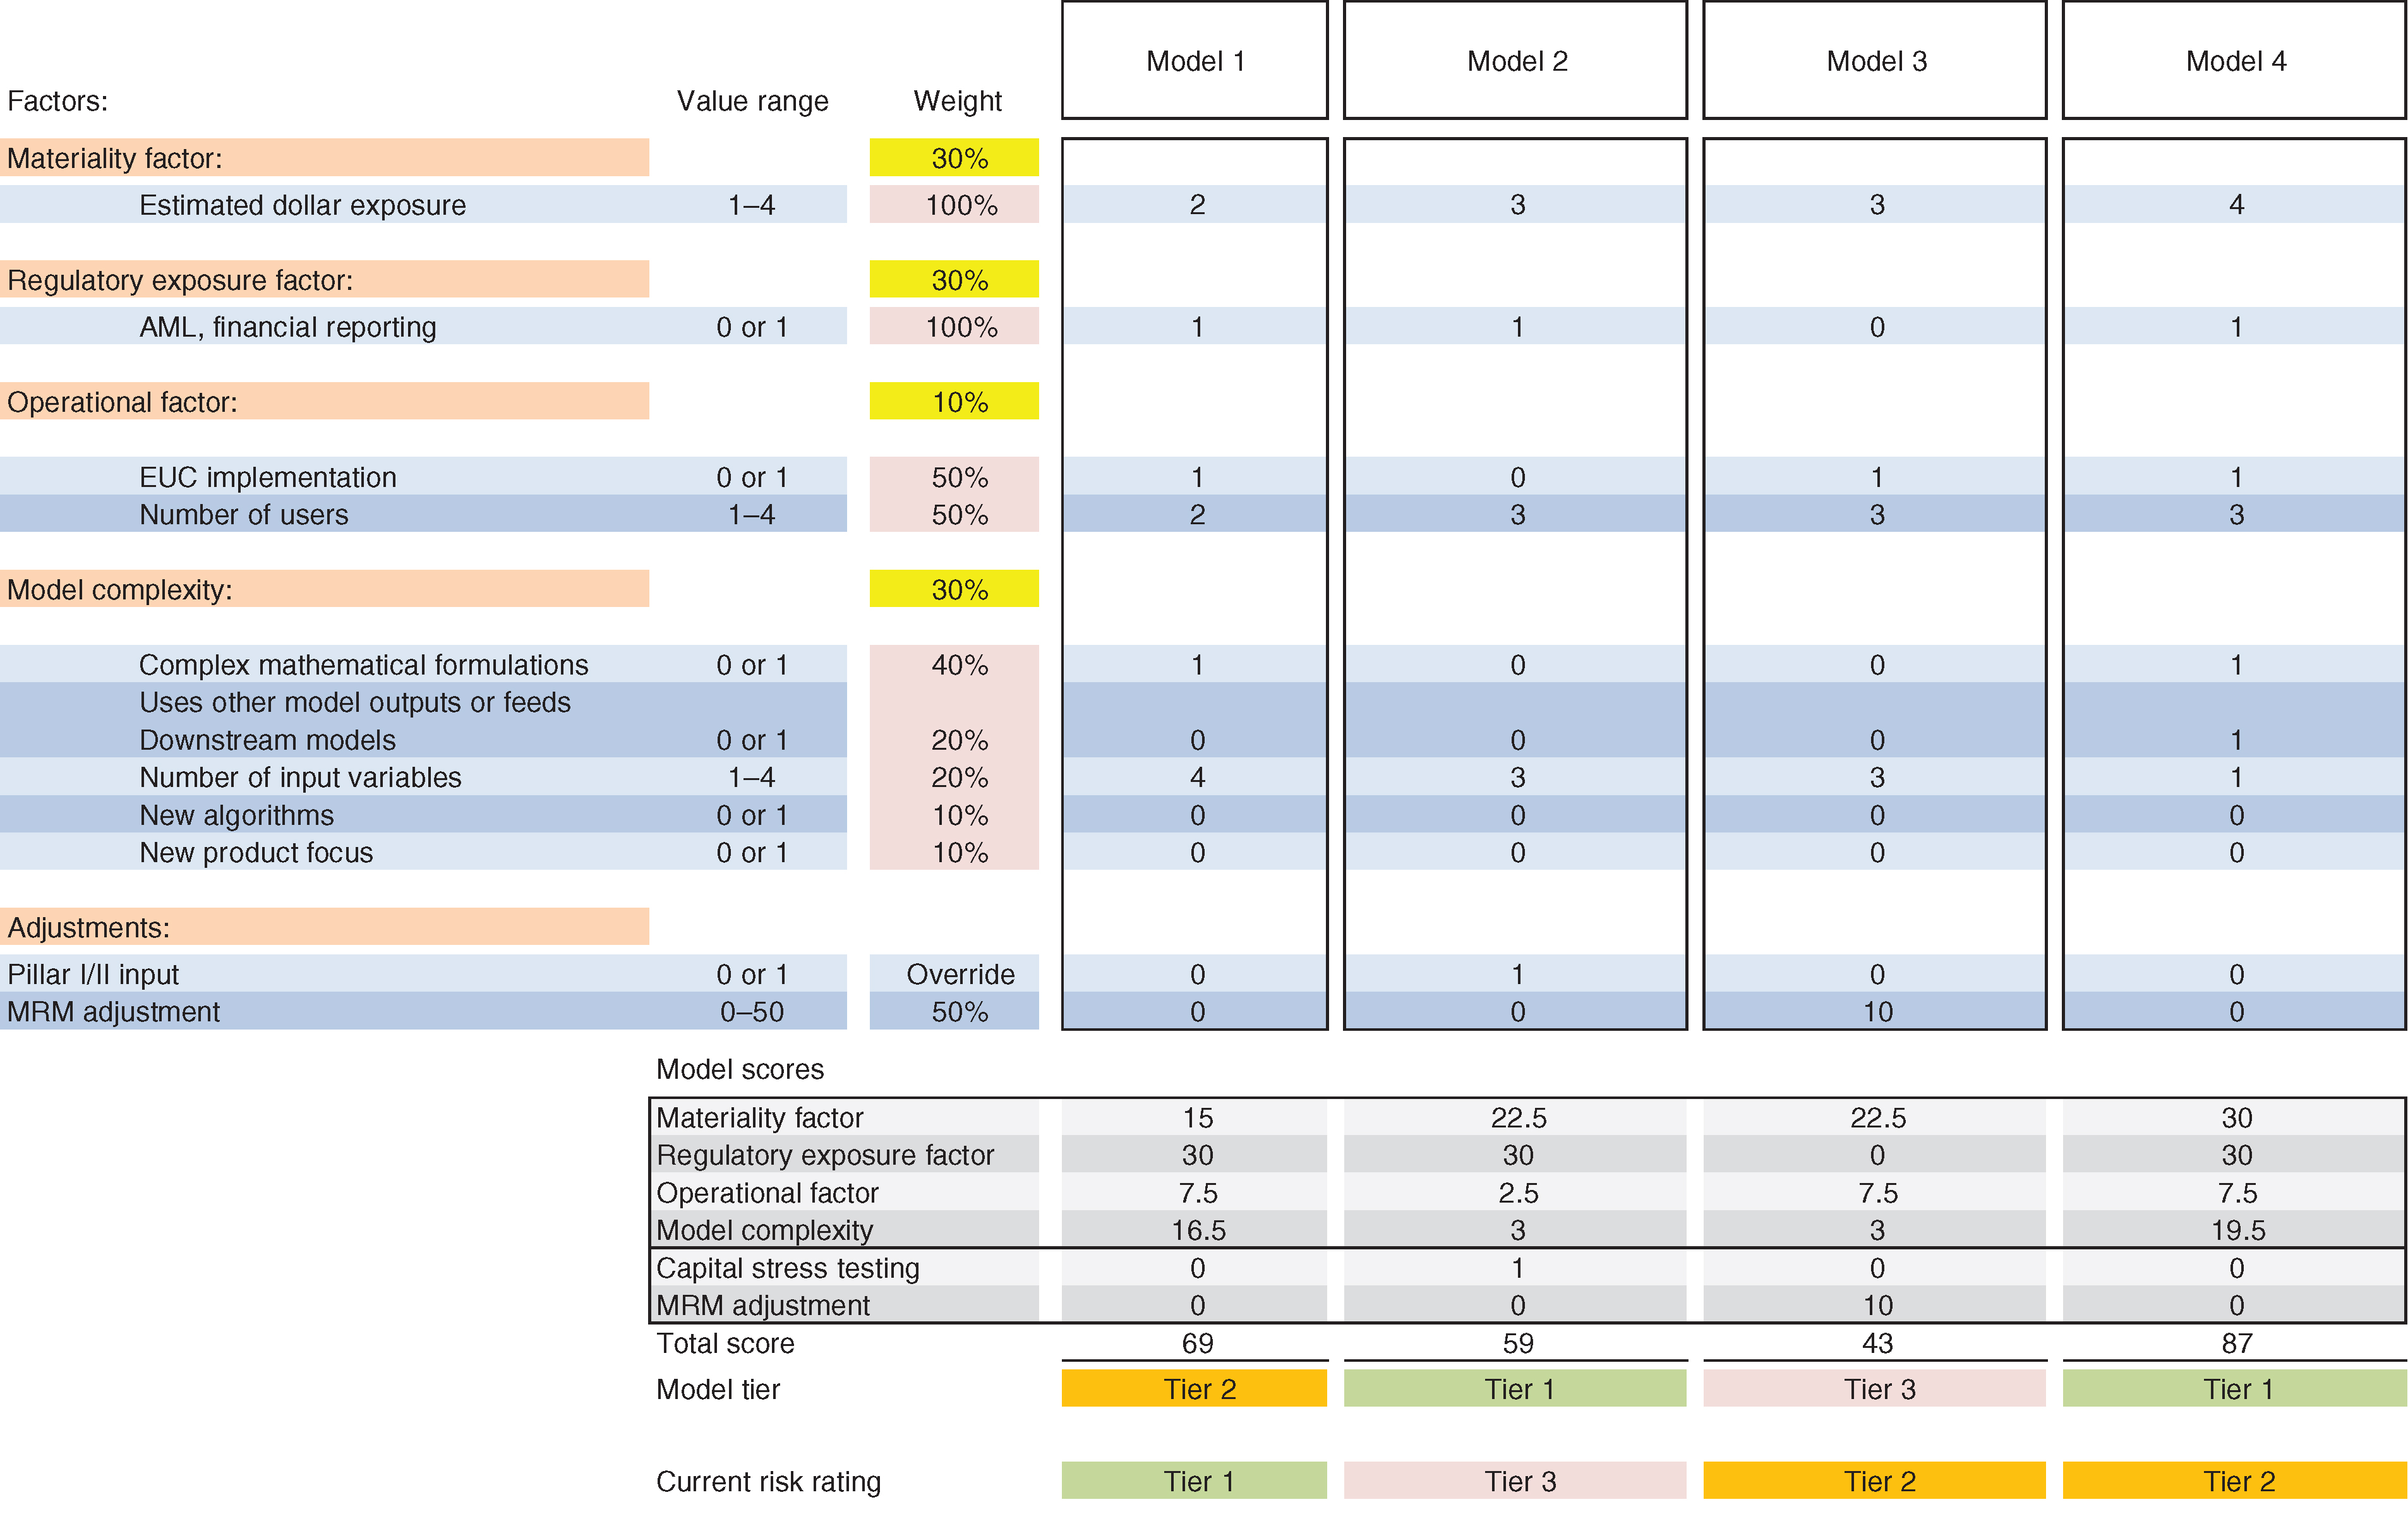
The sample MRS in Figure 3 is clearly more complex than the sample MRT in Figure 2. It mixes binary variables with multiple-level categorical variables. It also incorporates a weighting scheme that may be less intuitive than that implicitly incorporated into the decision tree structure. However, the MRS has other advantages. For firms that wish to include several categorical variables with multiple levels, the MRS will likely prove easier to represent visually, and thus easier for users to understand.
To understand how this scorecard works, consider the calculation of the “operational factor”. This factor has a weight of 10% in the final score, with 50% contributed by the “EUC implementation” component, a binary variable with potential values of 0 or 1, and the other 50% contributed by the “number of users” multiple-level categorical variable with potential values of 1, 2, 3 or 4. The total value of this component in the final score for model 1 is . Since the total value before adjustments is 100, the “operational factor” contributes 7.5 points to the total score, as can be seen in the “operational factor” line for model 1 in the “model scores” box at the bottom of Figure 3.
The final “model tier” is recorded in the highlighted boxes in the bottom line of Figure 3. For this scorecard, the thresholds are 50 points for tier 2 and 80 points for tier 1. Two interesting cases are models 2 and 3. Model 2’s total score of 59 out of 100 points would place it in tier 2, but the model has been assigned to tier 1 because the “capital stress testing” override is set to 1, which automatically assigns all models used in capital stress testing to the highest tier. For model 3, the total score is points. In this case, MRM has decided to add an additional 10 points to bring the score up to 43, but this does not affect the final model tier assignment, since the total score remains below the 50-point threshold.
5 Design
Tiering tools are often developed as part of the initial development or overhaul of the larger MRM framework. We see a number of important preconditions for a successful development process, including the following:
- •
clear roles and responsibilities, particularly around the collection of model profile elements to be used by the model risk-tiering tool to generate tier assignments;
- •
close coordination between developers of the risk-tiering tool and the model owners in order to establish clarity around profile-element definitions and challenges in profile-element collection; and
- •
good communication across the firm regarding principles for developing the model-tiering tool and evolving tier assignments.
The choice between an MRT and an MRS – tree versus scorecard – is a key decision that determines other aspects of the design process, since some variables will be more amenable to one approach than to another. As noted above, a smaller number of binary variables are likely better suited to an MRT, whereas a larger number of categorical variables with multiple levels will be better suited to an MRS. Nevertheless, it is possible to develop the variables first and then to choose a tool design that accommodates the selection and availability of the chosen variables.
5.1 Factor/component approach
For ease of communication, we will use the nomenclature from Figure 3, calling the general dimensions of model risk that firms wish to incorporate into their risk-tiering tool “factors” and the specific variables chosen to indicate those risk dimensions “components”.
5.1.1 Factors
Many firms approach model risk tiering as analogous to credit analysis, creating a score based on factors that roughly correspond to the two credit-risk dimensions of probability of default and loss given default. In the case of model risk, the analogs are the probability of model failure (how likely it is the model will experience a problem) and the impact of model failure (the consequences for the firm if the model does experience a problem). Some firms make this two-dimensional approach explicit, although for many it is merely implicit in the selection of factors.
With regard to impact, firms generally consider materiality, which may depend either on size (such as the notional value of exposures to which the model applies) or on use. The example illustrated in Figure 3 includes a materiality factor. Many firms consider both economic consequences and regulatory consequences; models that are used for financial reporting or to meet regulatory requirements carry the potential for greater impact, all else being equal. Figure 3 includes a regulatory exposure factor.
Some firms also add a separate factor to indicate the potential reputational impact of model failure, particularly where this factor would raise some models to a higher risk tier.77 7 Examples of such models include those made available for public or customer use, or models used internally in investment advisory. The example in Figure 3 does not include a stand-alone reputational impact factor.
As discussed above, the FHFA’s guidance (Federal Housing Finance Agency 2013) is the only formal supervisory reference to model risk tiering of which we are aware.88 8 Office of the Superintendent of Financial Institutions (2017) includes a requirement for a “model risk materiality classification scheme”, which may include “quantitative factors such as the size and growth of the portfolio that the model covers in addition to its capital impact (eg, VaR). Qualitative factors such as model age, complexity, purpose and strategic importance may also be considered, where relevant, as long as this is done in a consistent fashion.” It highlights complexity, business impact and “extensiveness of use” as factors to consider in a model risk-tiering approach. These factors align with the approach described above. Complexity is a standard indicator of probability of model failure, with more complex models being considered more prone to errors, ceteris paribus. Figure 3 includes a model complexity factor. Business impact serves as a blanket indicator of the potential impact of model errors. Extensiveness of use could be another indicator of probability of model failure, as more extensive model use may increase the likelihood of model misuse; or it could capture aspects of impact, as more extensive model use would tend to mean that repercussions of any model failure would be felt across a broader portion of the institution.
The example in Figure 3 includes an operational factor to cover the risk of model failure due to lapses in the control environment within which the model resides. While differences in the probability of model failure due to the nature of model controls may be important, a factor of this type should only be included if the nature of model controls is unlikely to be affected by tier assignments. Otherwise, the inclusion of a controls factor in tiering, with tiering in turn influencing required controls, may create instability in the risk-tier assignment due to potential circularity.
5.1.2 Components
Firms must identify one or more specific components for each factor to be reflected in the model-tiering tool; these are the variables in the tree or scorecard. In choosing components, builders of tiering tools generally show a preference for those that can be objectively measured and can be transparently observed (preferably within the existing inventory system). However, even firms that have already built robust model inventories may find that they need to significantly expand the scope of model profile elements collected in the inventory in order to capture the variables required by the model risk-tiering tool.
In practice, a wide variety of components are used in model risk tiering. In this section, we discuss examples of some of the typical components used in tiering tools.
Impact of model failure.
Impact generally depends on some calculation of materiality, with materiality being measured in a wide variety of ways. In general, those measures reflect either size or use, as described below.
Size.
Firms use a variety of variables to indicate the size of the impact of potential model failure on model results. Firms usually find estimating, or even classifying, the level of impact of a particular model on a given output to be surprisingly challenging. The challenge arises when the organization attempts to estimate how much a model error could affect the modeled result instead of the more tractable, but arguably less relevant, calculation of the historical impact of the model on the result. To gauge the impact of a model failure, firms generally use some combination of the following:
- •
current (book or market) value of the items modeled;
- •
sensitivity of values to model error, sometimes indicated by calculated risk metrics such as “vega”, or sensitivity to changes in volatility;
- •
number of customers exposed to the modeled item, or number of items modeled; and
- •
impact of (or reliance on) the model on the final result (this is nearly always a judgment).
The example in Figure 3 uses estimated dollar exposure (current book or market value) as the only component of the materiality factor.
Use.
Firms generally make categorical distinctions among model uses. Examples of categories include general business, accounting and regulatory reporting, pricing and risk management, and fiduciary uses.
Most firms view general business use as presenting the least potential impact due to model failure. Some common examples of model uses included in this category are
- •
direct mail targeting,
- •
business planning and budgeting, and
- •
employee compensation.
Many firms see financial accounting and regulatory reporting as presenting the highest model risk. Some distinguish these as two different uses or even place specific regulatory uses in separate categories. An example of the latter approach is evident in the sample MRS in Figure 3, where use in regulatory stress testing leads to an override of the scoring results. Common examples of model uses included in this category are
- •
balance-sheet reporting,
- •
allowance for loan and lease losses,
- •
supervisory stress testing,
- •
regulatory capital or its components, and
- •
potential future exposure for financial derivatives.
The regulatory exposure factor in the example in Figure 3 has as its single component the use of models in AML, financial or board reporting.
Some firms view models used for pricing and risk management as presenting risk similar to that posed by models used for accounting and regulatory compliance, while others view pricing and risk management uses as presenting less risk. Common examples of pricing and risk management uses include
- •
residential-mortgage pricing,
- •
commercial-credit pricing, and
- •
asset-liability management.
Firms show a wide range of practices in their treatment of models used to advise clients or otherwise inform the allocation of client investments. Most consider the use of models to carry out fiduciary duties as a significant contributor to model risk. The case of AXA Rosenberg mentioned above, in which a financial firm that lost most of its assets under management after paying USD217 million in restitution to clients and a USD25 million fine to the SEC to settle a case in which it was found to have concealed a model error, suggests the potential significance of such models. However, some firms view the use of models for fiduciary activities as outside the scope of their model governance frameworks.
Risk of model failure.
Firms attempt to identify features of models, or of the use of those models, that may make model failures more likely. Some may be fairly subjective, such as whether the firm has prior experience with the modeled product or modeling process, or model complexity (although some firms devise metrics to characterize complexity). A sample of common components used to indicate risk of failure is provided below:
- •
model complexity (either measured using various metrics or set by judgment);
- •
firm experience with the modeled product or modeling process;
- •
dependence on upstream feeds from other models;
- •
use of model results in downstream models;
- •
nature of implementation platform (end-user computing platform or IT-controlled application); and
- •
number of users.
The framework illustrated in Figure 3 includes complex model formulations and number of input variables (model complexity) as well as new algorithms and new product focus (firm experience) and uses other model outputs or feeds downstream models (use of feeds from other models, feeds into other models) as components of the model complexity factor. Figure 3 also uses EUC implementation (implementation platform) and number of users as components of the operational factor.
5.2 Selecting and collecting input data
Decisions regarding which components to include are usually best made in conversations or workshops led by the MRM group and involving a wide range of stakeholders. This wide participation not only encourages acceptance and ownership of the process across the organization but also gives valuable information regarding the difficulty of obtaining the different data elements and assessing their reliability and meaningfulness as risk indicators. It is good practice to begin the collection process by targeting multiple components for each factor, since the data-collection process is unlikely to result in a full set of data for every component targeted for use in the model-tiering tool.
Once the proposed list of components is settled, primary responsibility for data collection and maintenance generally falls to model owners (and their staff) regardless of whether model owners are developers or users. Of course, the model owner may not be the ultimate source of that data, which likely comes from a variety of sources: in many cases, from model users. The MRM group may create a questionnaire in order to solicit the desired model profile elements from model owners and others. Respondents to the questionnaire are generally required to certify their information on a “best efforts” basis and revise and recertify it annually or in the event that the model is revised or its uses changed. The MRM group should carefully review responses for completeness and reasonableness. The tiering-tool developer should maintain a dialogue with model owners to discuss missing or questionable values and to ensure that data is in a usable form and comparable across models.
While much of the model profile data used in tiering tools is easily observable, many practitioners seek to add one or more variables that are judgmental. For instance, some model-tiering tools require an estimate of the impact or contribution of each model on a larger calculation, such as regulatory capital. While intuitively appealing, such variables can be problematic if the level of actual or potential impact of a model on its outputs is unconstrained. For example, when experts attempt to determine the maximum impact of catastrophic model errors in such situations, they frequently find that number to be very large, or very hard to quantify, or both. Such exercises are often reliant on expert heuristics. Disagreements regarding such heuristic inputs can be very challenging to resolve. In part because of these challenges, many tiering-tool development processes revert to more easily observable metrics, but this sometimes comes at the expense of useful information.
Different types of components require different treatment. Quantitative variables with a wide range of potential values are generally converted into categorical variables represented by a number of integer values, such as categories one through five. Many judgmental variables are also represented in practice by an integer scale; in that case, narrative descriptions of the values on the scale may need to be developed in discussions with stakeholders. Other components may be reduced to simple binary measures. Regardless of which form a component takes in the tool, it is best to collect the input data in the most granular form possible, to maximize its information content and the flexibility of the tool-construction process.
Once the input data is collected, the usual data-hygiene processes must be completed, such as cleaning data and converting text entries to categorical variables. In practice, this stage can be quite time-consuming, as respondents are likely to interpret profile-element requests differently, regardless of the care taken in the development of questionnaires or other instruments, and the descriptive information provided in response may take a wide variety of styles. Enough time should be allowed for significant back-and-forth between the tool developer and respondents in order to develop a data set that is as robust and consistent as it is practical.
5.3 Tool structure
Once the input data has been collected, the structure of the model-tiering tool must be chosen. One of the most fundamental decisions is between the tree and scorecard approaches discussed above: that is, between using an MRT and using an MRS.
For an MRT, the design challenges related to tool structure can be much more significant than those for an MRS. For trees, decisions such as in which order to place nodes, which nodes belong on which branches, and which branches to prune are inseparable from calibration decisions such as where to set thresholds and the assignment of final branches to risk tiers.
For an MRS approach, developers must choose whether to weight and add up risk-component variables separately or to add them up by factor subgroups. Additional choices include whether or not to include automatic overrides, whether to include actual values for continuous variables (such as dollar volume) or convert them to a more constrained form (such as categories or ranges), and whether to limit the maximum potential contribution of variables.
In addition to choosing between the MRT and MRS frameworks, tool builders also need to decide whether to make tier assignments at the model level or at the model/use pair level. Tiering models at the model/use pair level means treating the combination of a model and each of its business uses as if they were unique models, and tiering them on a stand-alone basis. As a result, a single model may receive multiple risk-tier assignments depending on use. Firms using this approach often base MRM requirements on the highest tier assigned to any model/use pair. More commonly, however, firms apply their tiering tools to create a single tier for each model, taking into account all of a model’s uses at once. Models with more model uses are more likely to be assigned to higher risk tiers.
Which approach is more appropriate depends on the MRM framework and practices of the individual firm. Since the depth and frequency of validation activities are frequently driven by a model’s risk-tier assignment, firms that conduct separate validations for different model uses might reasonably choose to utilize the model/use pair approach, while those that conduct validations covering all of a model’s uses might use the model-centric approach.
6 Calibration and implementation
Calibration is the process of tuning the algorithm that translates model data into a risk-tier assignment. Effective calibration depends on a combination of factor and component variable selection as well as properly setting weights and thresholds associated with their use. Although this paper only addresses calibration for scorecard-type tools, some calibration is required for decision trees as well.
6.1 Variable creation
Many firms apply a bucketing scheme to each component variable with a wide or continuous range of potential values, converting it to a categorical variable in order to reduce data dimensionality. This may be done simply to ease the tool-construction process, to constrain the impact of the variable on the final value or to accommodate a variable believed to bear a nonlinear relationship to model risk when expressed in its natural units. For instance, a variable such as the dollar value of exposures covered by a model might be seen as having a greater risk-differentiation power for each dollar change at low values than it does at very high values. Alternative approaches to such nonlinearity, such as converting data using a fractional exponent to convey the change in marginal impact as values rise, are not generally employed.
If particular data items are not available for some models, the developer must decide whether to drop the variable from the tool or to set an arbitrary value for the initial calibration process. Through this iterative process, the risk-tiering tool may be further revised.
6.2 Setting weights and thresholds
Choosing a set of inputs to represent the components for the various risk factors does not determine how models will be tiered. The same set of factors and components can lead to an almost endless variety of tier assignments depending on how the variables are combined and weighted. The determination of an appropriately weighted combination is the essence of calibration. In this section, we address the calibration of MRS-style model risk-tiering tools.99 9 The calibration of MRTs, while analogous, will differ in important aspects.
Depending on the structure of the MRS, calibration may be required at multiple levels:
- •
the thresholds of any buckets for individual variables;
- •
the weighting of components;
- •
the weighting of factors; and
- •
the setting of thresholds for converting the final score to a recommended risk-tier assignment
Once the approach to the MRS is chosen, developers commonly use one of two approaches to develop their initial model calibration: expert judgment or regression analysis. Under the expert-judgment approach, the developer sets parameters that are intuitively appealing and then experiments with varied parameters to reach the desired results. Developers will generally look for results to meet the following constraints.
- •
Risk-tier assignments generally align with any existing assignments from a legacy approach or conform to intuition.
- •
Each component has a meaningful impact on the result (eg, no component has a weight so low that it would never be expected to determine a risk-tiering result).
- •
The parameters and structure of the MRS are intuitive.
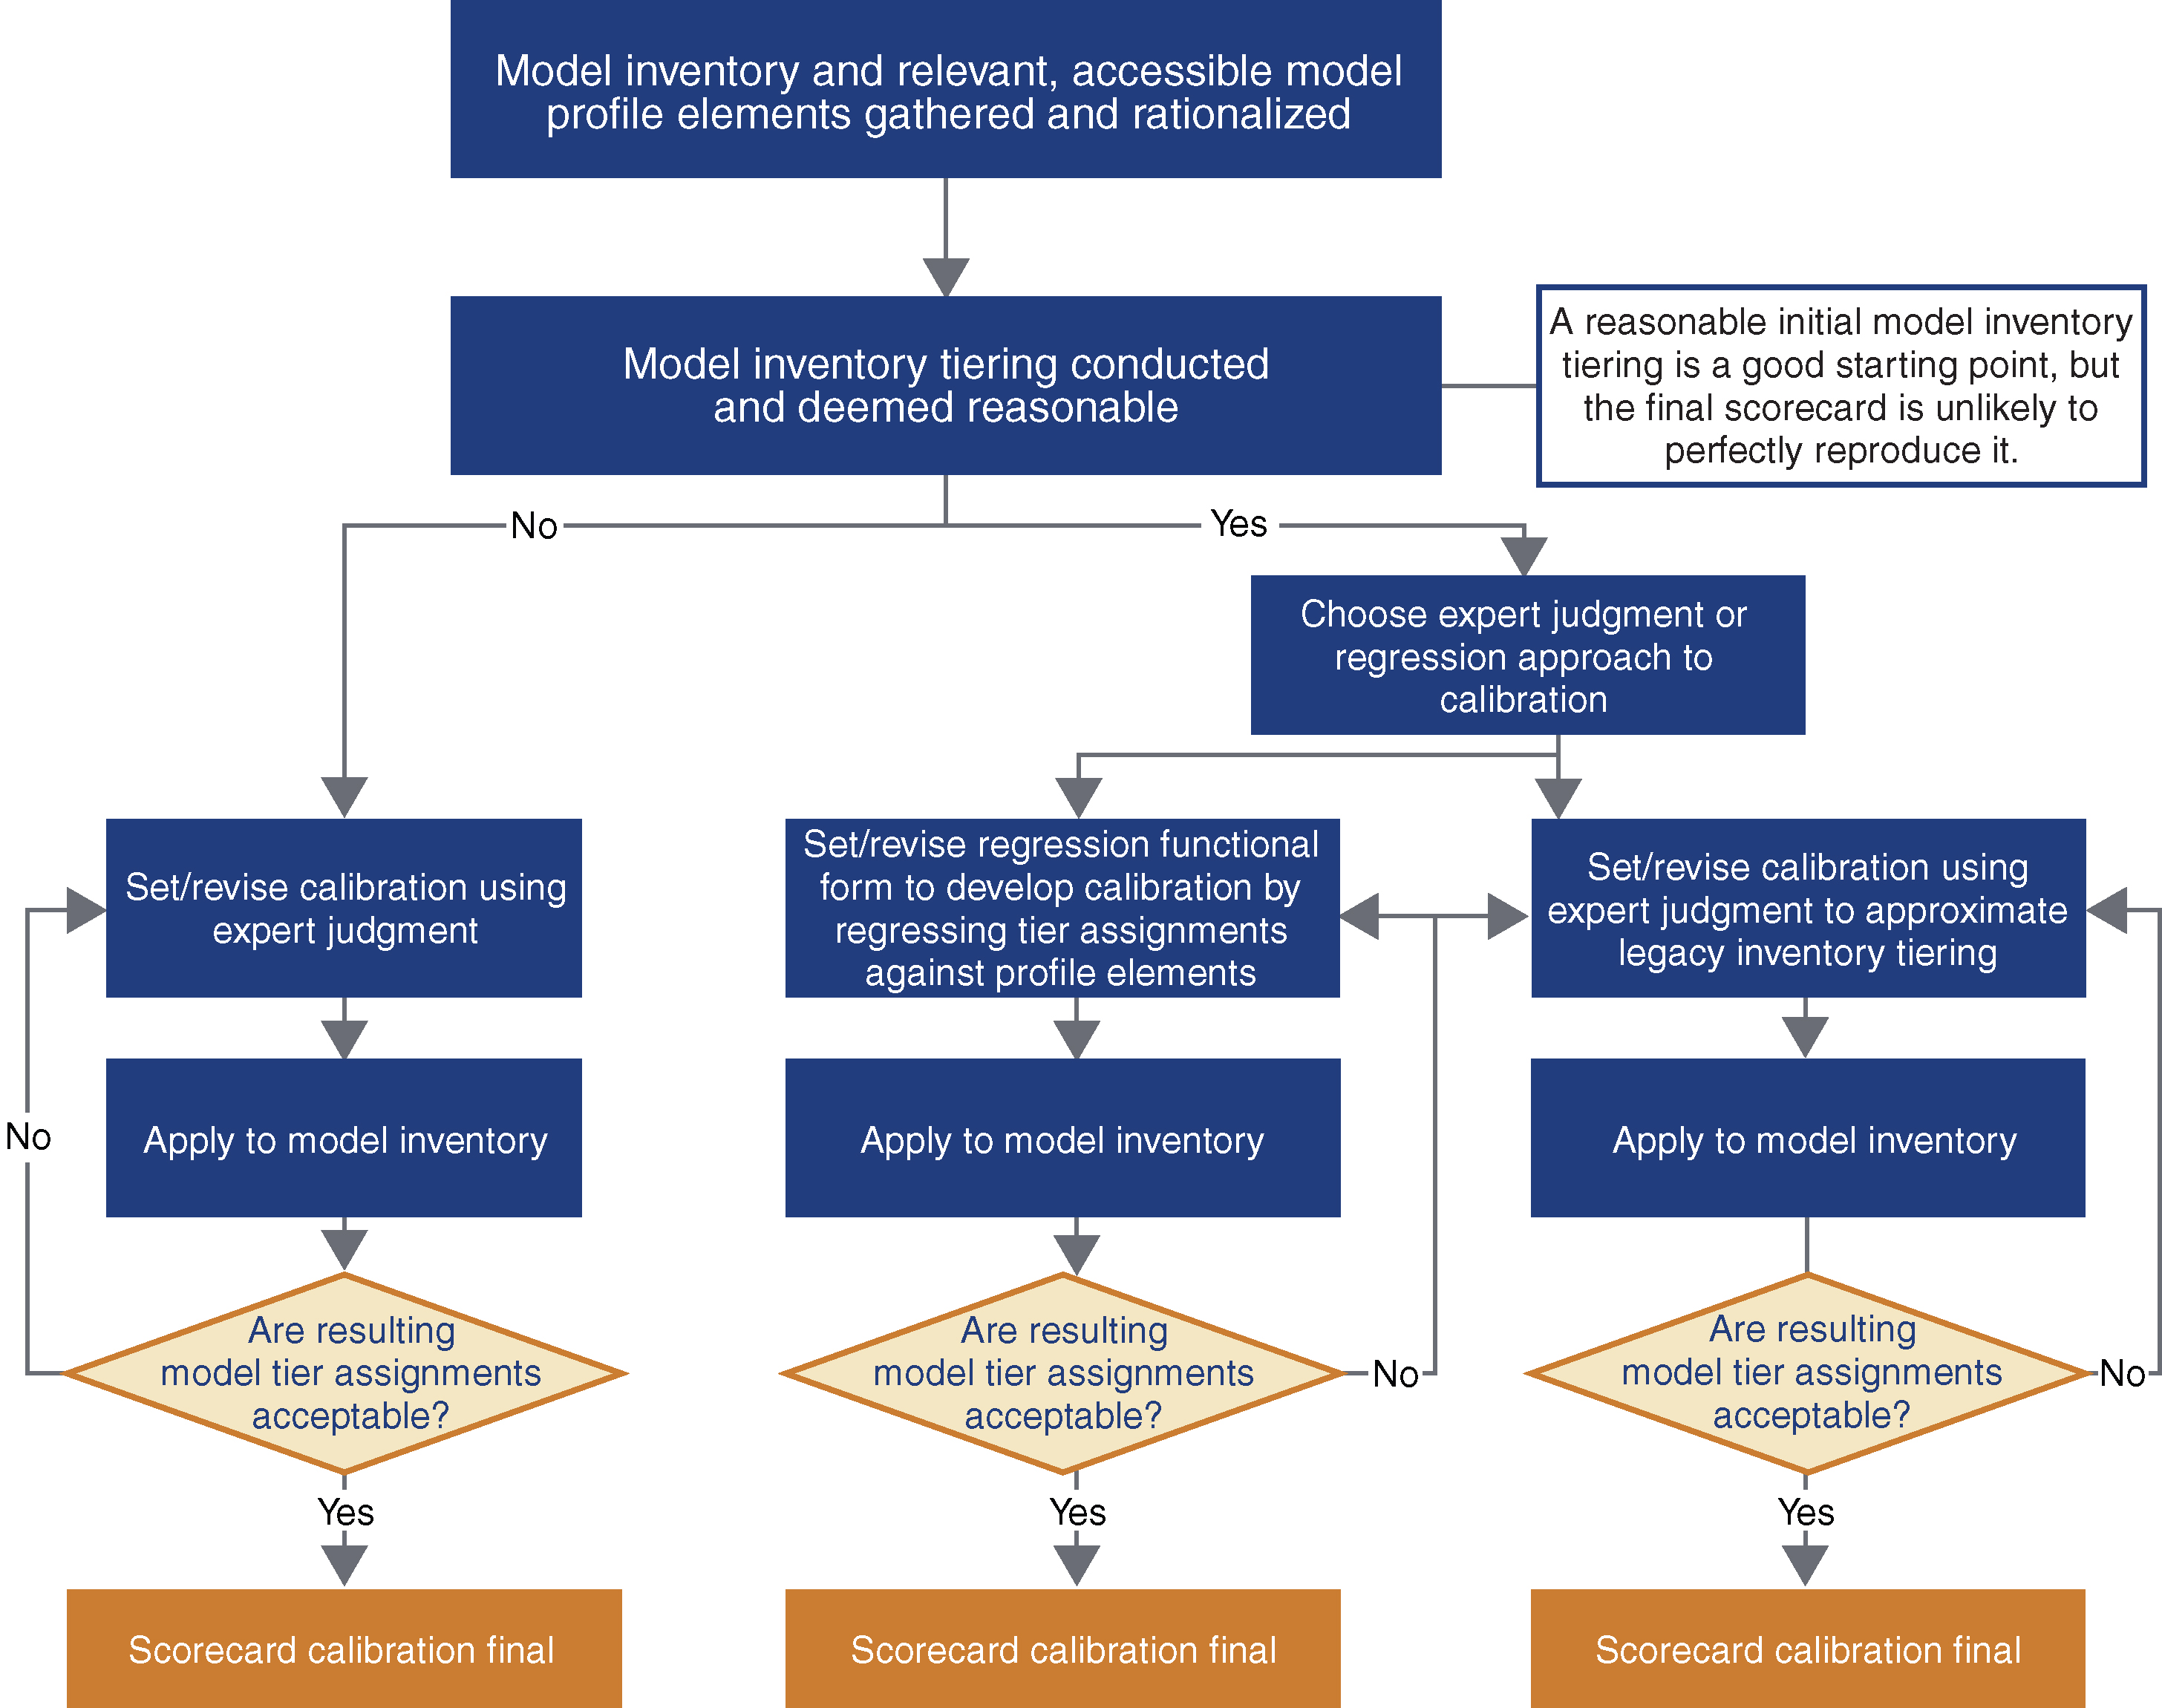
In firms without a preexisting rated-model inventory, the MRM group usually applies considerable judgment regarding calibrations, as shown on the left-hand side of Figure 4. Legitimacy for calibrations in this environment is generally established by communicating the results of the calibration exercise to stakeholders, inviting feedback and emphasizing the overall reasonableness of the risk-tier assignments rather than extensively negotiating the details of individual component or factor weights.

In firms without preexisting model risk-tier assignments, the first round of such exercises frequently results in an excessive number of models being assigned to the highest risk tier. Unless the model universe is such that very few models are utilized in a large number of applications, such a distribution should not be accepted. As discussed above, the MRS is a tool for distinguishing the riskiness of models within an inventory; the placement of too many models into a single risk tier suggests that it is not differentiating risk as intended. In that case, further calibration or changes to the tool’s structure are likely necessary before the tool can be considered finalized.
For firms that have a legacy approach and therefore begin with an existing distribution of models across risk tiers, the calibration of a new framework may proceed somewhat differently, as illustrated by the flow on the right-hand side of Figure 4. In such cases, maintaining the preexisting relative ranking of models is often seen as a desirable feature for the new system, and risk managers may aim to minimize the number of model risk assignments that change under the new tool. Assuming that some degree of confidence in current tier assignments is justified, controlling changes in risk tiers has the advantage not only of minimizing the incremental work to implement the new approach but also of incorporating and making more systematic the information contained in preexisting processes, while increasing the general organizational acceptance of the new tiering methodology.
Calibration to replicate an existing distribution is usually accomplished through trial and error, using either expert judgment or alternative functional forms to bring the distribution of models across risk tiers close to that of the current inventory. In some cases, firms can use regression-based approaches to determine a combination of model profile elements and weightings that produces an appropriate risk tiering of models. If the existing model distribution across tiers is regarded as a valid starting point, then a well-tuned statistical and/or iterative calibration process will replicate the current model risk-tier assignments as closely as possible using the model profile elements collected. This process is complete once the resulting model risk tiers and calibration parameters are deemed reasonable by management.
Although the initial tier assignments serve as a valuable anchor for a new calibration, the old and new tier assignments should not be required to be, or expected to be, identical. The consistency imposed on model risk assessment by a well-structured MRS should be expected to result in some movement of models between model tier assignments. Considerations that may reasonably affect the distribution of models across tiers commonly include the following:
- •
the extent to which individual models are reused for different products or in different applications (eg, a firm in which a small number of models are utilized broadly will have a smaller inventory, with a larger proportion of high-risk models, than one in which each use tends to generate its own model);
- •
the comprehensiveness of the inventory, since models omitted from the inventory are likely considered less crucial and would thus likely fill out the lower risk tiers;
- •
the alignment of tier-specific MRM requirements with the risks posed by the models assigned to each tier; and
- •
the proportion of the inventory that must be assigned to the top risk tier due to supervisory pressure (eg, examiners may suggest that all models used in stress testing should be assigned to tier 1).
Once a near-final calibration is established, the MRM group should lead a process to resolve any issue with new risk-tier assignments through discussions with model owners and business leads. At the end of this process, some firms will also choose to set overrides in the MRS to guarantee a minimum tier assignment for models of certain types or with certain uses, such as those required in regulatory-compliance activities.
Our experience has been that initial model calibration frequently results in risk-tier assignments for the model inventory with which managers are dissatisfied, particularly at firms with preexisting model risk-tier assignments. While a tiering tool should not be required to perfectly replicate an inventory’s preexisting tiering, it is important that the tool be able to generate tiers that are generally consistent with expert opinion where that opinion is itself internally consistent. Depending on the choice of inputs, calibrating an MRS to be broadly consistent with current risk-tier assignments may prove easier than doing so with an MRT.
7 Governance
Any enterprise risk management process should be subject to appropriate governance, and model risk tiering is no exception. Established governance practices regarding model risk-tiering tools include the incorporation of risk-tiering procedures into the model-governance framework and the assignment of clear roles and responsibilities. A common practice is to give ownership of tool development and maintenance to the MRM function. The head of the MRM function generally has final sign-off on model risk-tier assignments, with model owners and model users given an opportunity to challenge and escalate tier assignments in the event of disputes. Most firms also include explicit or implicit requirements for reevaluation of model risk-tier assignments on at least an annual basis, including a review of the model profile elements used for model risk tiering.1010 10 This reevaluation is generally part of the annual model review and meets the expectation in the US banking agency guidance (2011 and 2017) that “[b]anks should conduct a periodic review – at least annually but more frequently if warranted – of each model to determine … if the existing validation activities are sufficient”.
Best practices and other important aspects of model risk-tiering governance are still emerging and not yet standardized. Leading firms maintain the model profile elements necessary to populate risk-tiering tools in the model inventory system while others maintain such information in spreadsheets or within a version of the tool itself. Likewise, some firms require model owners to attest to the accuracy of the relevant profile elements while others do not.
Supervisors appear to increasingly expect internal audits to evaluate the reasonableness of the model risk-tiering process. Although risk tiering is not directly addressed in the US banking agency guidance, that guidance does state other supervisory expectations for internal audits, including the assessment of the “accuracy and completeness of the model inventory” and the evaluation of “whether MRM is comprehensive, rigorous, and effective”.
Another emerging practice in the governance of model risk tiering is the treatment of some risk-tiering tools as models themselves. In firms where such tools are subject to the same documentation, validation, periodic review and even risk tiering as the rest of the model inventory, this treatment is another step in establishing both transparency and firm-wide acceptance of the model risk-tiering framework.
8 Conclusion
As models continue to play a growing and central role in business operations, MRM will remain an area of focus for both senior executives and regulators. Leading financial institutions take a risk-sensitive approach to MRM in which model risk tiers drive the frequency and depth of MRM activities. Model risk tiers are typically assigned using a tool designed to ensure that they are determined consistently and objectively.
The design of model risk-tiering tools draws upon a variety of principles.
- •
Expert judgment is instrumental for the design of a model risk-tiering tool. However, the tool’s design should ensure that tiers are produced objectively rather than subjectively by the tool’s user.
- •
In order to be embraced throughout an organization, a model risk-tiering tool should be transparently designed and generate consistent results.
- •
Model risk tiers should depend on a model’s inherent risk rather than a model’s residual risk.
- •
Model risk tiers provide an indication of the relative (not absolute) risk posed by model use.
- •
When designing a model risk-tiering tool, developers should consider the relative risk posed by models both within and across business units and legal entities.
- •
Model risk-tiering tools should be simple and easy to use.
- •
A model risk-tiering tool should broadly distribute the model inventory across the risk tiers.
- •
Model risk-tiering tools should produce results that are broadly in line with management expectations.
In both literature and practice, we have observed two types of model risk-tiering tools: decision trees and scorecards. Decision trees are designed such that users answer a series of questions regarding a model to guide the assignment of a model’s risk tier. Scorecards assign values based on a model’s attributes, with the values then subjected to a weighting scheme to produce a model risk score; scores within defined ranges are mapped to model risk tiers.
Calibration plays an important role in the tool-design process, determining both the thresholds used to map model risk scores to tiers and the weights and thresholds associated with individual model risk-tiering factors and components. Due to their design, scorecard tools are generally easier to calibrate than decision trees.
Governance around the construction and use of model risk-tiering tools is an evolving area. Similar to other aspects of risk management, effective model risk tiering should rely on a clear allocation of roles and responsibilities with a comprehensive documentation framework to guide activities. Model developers, model owners and users, model risk managers and internal auditors all play valuable roles in developing, maintaining and ensuring compliance with effective model risk-tiering procedures.
Model risk-tiering tools provide a systematic assessment of the relative risk posed by different models subject to a given governance framework within a firm-wide inventory. The clear value of these tools is that they provide a transparent and consistent way to determine model risk-tier assignments, which are a critical building block for the practice of consistent and effective risk-sensitive model governance.
Declaration of interest
The authors report no conflicts of interest. The authors alone are responsible for the content and writing of the paper. The views and conclusions contained herein are those of the authors and should not be interpreted as representing the views or conclusions, either expressed or implied, of Promontory Financial Group.
References
- American Bankers Association (2017). Model risk management (“MRM”) survey. Report, AMA. URL: http://www.aba.com/Groups/MRMWGdocs/SR1519survey1709.pdf.
- Board of Governors of the Federal Reserve System (2011). Guidance on model risk management. Supervision and Regulation Letter SR 11-7, Federal Reserve Board.
- Committee of European Banking Supervisors (2006). Guidelines on the implementation, validation and assessment of advanced measurement (AMA) and internal ratings based (IRB) approaches. Guidelines, European Banking Authority.
- Committee of Sponsoring Organizations of the Treadway Commission (2004). Enterprise risk management: integrated framework. Executive Summary, September, COSO.
- Deng, H., Runger, G., and Tuv, E. (2011). Bias of importance measures for multi-valued attributes and solutions. In Proceedings of the 21st International Conference on Artificial Neural Networks (ICANN 2011). Springer (https://doi.org/10.1007/978-3-642-21738-8_38).
- European Parliament and Council of the European Union (2009). Directive 2009/138/EC of the European Parliament and of the Council of 25 November 2009 on the taking-up and pursuit of the business of Insurance and Reinsurance (Solvency II). EUR-Lex.
- European Parliament and Council of the European Union (2013). Regulation (EU) No 575/2013 of the European Parliament and of the Council of 26 June 2013 on prudential requirements for credit institutions and investment firms and amending Regulation (EU) No 648/2012 Text with EEA relevance. EUR-Lex.
- Federal Deposit Insurance Corporation (2017). Adoption of supervisory guidance on model risk management. Financial Institution Letter FIL-22-2017, FDIC.
- Federal Housing Finance Agency (2013). Model risk management guidance. Advisory Bulletin AB 2013-07, FHFA.
- Keenan, S. C. (2015). Financial Institution Advantage and the Optimization of Information Processing. Wiley (https://doi.org/10.1002/9781119053309).
- Lewis, R. J. (2000). An introduction to classification and regression tree (CART) analysis. Conference Paper, 2000 Annual Meeting of the Society for Academic Emergency Medicine in San Francisco, California.
- Mankotia, S., and Joshi, A. (2013). Measuring model risk: a practitioner’s approach. RMA Journal, July 1.
- Office of the Comptroller of the Currency (2000). Model validation. Bulletin 2000-16, OCC.
- Office of the Comptroller of the Currency (2011). Supervisory guidance on model risk management. Bulletin 2011-12, OCC.
- Office of the Superintendent of Financial Institutions (2017). Enterprise-wide model risk management for deposit-taking institutions. Guideline E-23, OSFI.
- Securities and Exchange Commission (2014). Nationally recognized statistical rating organizations. Final Rules, 17 CFR Parts 232, 240, 249 and 249b, SEC.
- Securities and Exchange Commission (2016). Standards for covered clearing agencies. Final Rule, 17 CFR Part 240, SEC.
Only users who have a paid subscription or are part of a corporate subscription are able to print or copy content.
To access these options, along with all other subscription benefits, please contact info@risk.net or view our subscription options here: http://subscriptions.risk.net/subscribe
You are currently unable to print this content. Please contact info@risk.net to find out more.
You are currently unable to copy this content. Please contact info@risk.net to find out more.
Copyright Infopro Digital Limited. All rights reserved.
You may share this content using our article tools. Printing this content is for the sole use of the Authorised User (named subscriber), as outlined in our terms and conditions - https://www.infopro-insight.com/terms-conditions/insight-subscriptions/
If you would like to purchase additional rights please email info@risk.net
Copyright Infopro Digital Limited. All rights reserved.
You may share this content using our article tools. Copying this content is for the sole use of the Authorised User (named subscriber), as outlined in our terms and conditions - https://www.infopro-insight.com/terms-conditions/insight-subscriptions/
If you would like to purchase additional rights please email info@risk.net