The return of retail LBOs
Leveraged buyouts in the retail sector are flavor of the month, with three big deals in the pipeline. Steven Miller looks back to the last wave of retail deals in the late 1980s for clues as to how the current crop may fare

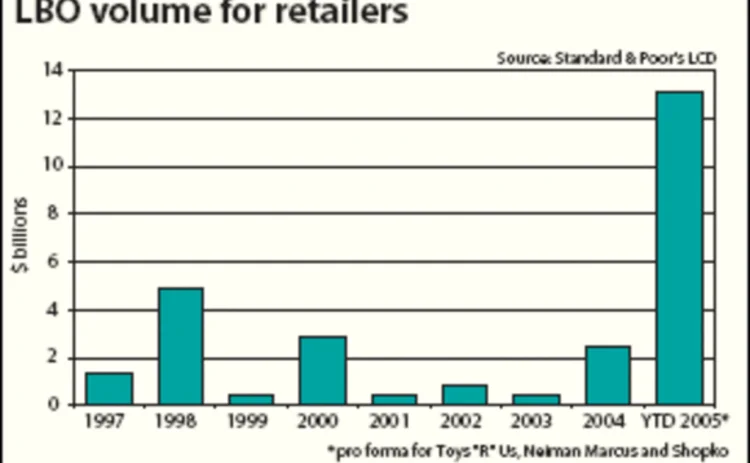
For the first time in a long while, big department store deals now comprise a major part of the leveraged buyout (LBO) calendar, with buyouts for Toys “R” Us ($5.7 billion), Neiman Marcus ($5.1 billion) and Shopko Stores ($1 billion) in the offing. Together, these deals will surely place retailing among the busiest sectors in the LBO market in 2005, after a lengthy absence.
Indeed, from 1996 through the first quarter of 2005, retail ranked twelfth among industry sectors, with 3.7% of all LBO loan volume. This retail reticence among loan market players is not surprising. LBOs of department store chains and other retail firms brought unprecedented pain to leveraged lenders, high-yield investors and private equity firms in the early 1990s, when a string of storied retailers filed for bankruptcy after undergoing LBOs, management buyouts and recapitalizations.
These deals were widely seen as a once-in-a-generation mistake, made possible only by the late-1980s leveraged finance free-for-all. For that reason, common wisdom was duly appended with the notion that retailing firms—with their thin operating margins and vulnerability to the whims of consumer demand—made a poor choice for highly leveraged undertakings.
Lessons learned
What follows is a look back on some statistics from late 1980s department store transactions that got into trouble, which may be a reference point for deals now in the offing. There were seven leveraged finance deals for retailers that defaulted in the early 1990s, according to Standard & Poor’s CreditPro database: Ames Department Stores, Best Products, Broadway Stores, Federated Department Stores, Hills Stores, Peebles Inc. and RH Macy.
To gather the initial credit statistics of these deals, Standard & Poor’s Leveraged Commentary & Data combed through SEC filings and registrations (S-1s and S-4s) from roughly the time of the original LBO or recap.
The most impressive fact about these deals? They were not as leveraged as most people remember. In fact, across the seven deals, the average ratio of pro forma debt to Ebitda was 5.10x, ranging from 3.60x for Peebles to 7.79x for Federated. When rents are included, the average ratio of debt plus eight times operating rents to Ebitdar (earnings before interest, taxes, depreciation, amortization and rent) increases to 5.52x, with a range of 3.94x to 7.83x. These leverage ratios are, in fact, roughly in line with deals in today’s LBO market.
It is on the coverage side, however, where the risks of late-1980s retailing deals are clear (in hindsight, anyway). The average cashflow coverage (Ebitda less capex to cash interest) of the seven deals was a wafer-thin 1.05x, with a range on the low end of negative 0.09x for Federated to 2.41x for Ames. And four of the seven deals had a coverage ratio of less than 1x out of the box.
How do these retailing deals compare with those of recent vintage? Not surprisingly, they were aggressive. Since 2004, in fact, four retail companies have completed LBOs or dividend recaps: Eye Care Centers, Savers, Dollarama and MAPCO Express. These deals, on average, had a debt-to-Ebitda ratio of 4.47x and a debt-plus-eight-times-rents-to-Ebitdar ratio of 5.60x. While the leverage is not markedly different, the average cashflow coverage of the recent deals, at 2.77x, is significantly higher than the deals from the late-1980s that went bust.
Investors that have been through a cycle or two with retailing—whether it be the late-1980s deals highlighted here or the spate of mid-1990s credits from Caldor, Bradlees, Edison Brothers, County Seat and several others—say there are three important things to remember.
For a start, regional retailers have a hard time in the face of competition from big, national franchises. What spelled doom for Caldor and Bradlees, for instance, were the obvious suspects: Wal-Mart and Target. As well, these retail juggernauts have gutted the Toys “R” Us franchise over time.
Leveraging retailers makes the best sense when sales volatility is low, as with supermarkets and drug store chains, and perhaps specialty retailers with a strong niche. This is an obvious point, to be sure: leverage works best in any situation, whether an LBO or a structured finance vehicle, when the underlying assets are stable. Again, this is an obvious point, lenders say, but is well worth remembering.
If you must leverage a retailer, accounts prefer to see leverage inside of 5x and senior debt covered by inventory. This is another obvious point, admittedly, but one that can get lost in frenzied markets.
Retail recoveries
The final data set that today’s lenders might find interesting is how the late-1990s set of retailing loans faired in default. The average loss given default on the loans was 92 cents on the dollar, based on the nominal payout, and 71 cents on a present value basis (discounting the ultimate return over the bankruptcy period), according to Standard & Poor’s LossStats database.
This looks much stronger, however, when Best Products, which was subject to a fraudulent conveyance that knocked the loan recovery down to just 43 cents nominal and 29 cents discounted, is excluded. For the six remaining loans, the average recovery jumps to 100/79 cents. This is inside the average discounted recovery of 85 cents for all non-retailing first lien loans that defaulted during that period.
Arrangers are quick to point out, however, that the 1980s numbers are based on loans that were, by and large, made at the holding company and that therefore allowed post-petition DIP (debtor-in-possession) lenders to, at times, jump in front of the pre-petition lenders via priming liens. By contrast, the new deals are typically asset-based executions that offer lenders infinitely more protection. Certainly that will be the case, sources say, for Toys “R” Us’ $2.8 billion revolving credit, which will be asset-based, according to an SEC filing. Likewise, Shopko’s prospective loan is expected to be asset-based, sources say.
Of course the object is to avoid losses of any kind. The early-1990s retail defaults came as high leverage met with a recession. Lenders say that it is no accident that retail deals are now popping up. Consumer spending has been growing for several years, as it did in the late-1980s and mid-1990s, creating a sense of stability for the sector. The economy has been softer this spring, though recently it has shown improvement. As the last part of our public service set forth here, we turn to Beth Ann Bovino, an economist at S&P, for a perspective on the state of retail sales.
“Retail sales surged 1.4% in April, a sharp improvement from the disappointing 0.4% gain posted in March, even after adjusting for the 2.5% price-driven surge in auto sales,” Bovino says. “Excluding autos, sales jumped a healthy 1.1%. Department store sales rose 1.3%, to partially offset the 2% drop in March. Apparel jumped 2.8%, to make up for the disappointing 1.6% drop in March. April confirmed that cold and rainy March weather was not conducive to buying new spring clothes, and Easter is not really big for retail sales.”
“But data suggest that higher oil prices and declining stocks are finally getting the attention of the American consumer, as April sentiment drifted downward,” Bovino continues. “That weak consumer confidence, however, does not yet seem to be hurting sales. April data suggests that the retail sales softness in March more likely had to do with bad weather and an early Easter than a perceived ‘soft patch’. Retail sales remain fairly strong, compared with a year ago, up 8.6%, and up 8.1% excluding autos. Department stores (+1.6%) and sporting goods (+2.2%) are the weak spots, offset by strength in electronics (+5.3%), non-store retailers (+12.4%), gasoline stations (+19.8%) and restaurants (6.9%).” Consumer sentiment is showing signs of bottoming out in May, as gasoline prices stabilize, up from the preliminary May reading though still down from April’s figures.
Steven Miller is the head of Standard & Poor’s LCD group, which is a provider of data and commentary for the leveraged loan and high-yield bond market. Marina Lukatsky conducted research for this story.
Only users who have a paid subscription or are part of a corporate subscription are able to print or copy content.
To access these options, along with all other subscription benefits, please contact info@risk.net or view our subscription options here: http://subscriptions.risk.net/subscribe
You are currently unable to print this content. Please contact info@risk.net to find out more.
You are currently unable to copy this content. Please contact info@risk.net to find out more.
Copyright Infopro Digital Limited. All rights reserved.
You may share this content using our article tools. Printing this content is for the sole use of the Authorised User (named subscriber), as outlined in our terms and conditions - https://www.infopro-insight.com/terms-conditions/insight-subscriptions/
If you would like to purchase additional rights please email info@risk.net
Copyright Infopro Digital Limited. All rights reserved.
You may share this content using our article tools. Copying this content is for the sole use of the Authorised User (named subscriber), as outlined in our terms and conditions - https://www.infopro-insight.com/terms-conditions/insight-subscriptions/
If you would like to purchase additional rights please email info@risk.net
More on Structured products
A guide to home equity investments: the untapped real estate asset class
This report covers the investment opportunity in untapped home equity and the growth of HEIs, and outlines why the current macroeconomic environment presents a unique inflection point for credit-oriented investors to invest in HEIs
Podcast: Claudio Albanese on how bad models survive
Darwin’s theory of natural selection could help quants detect flawed models and strategies
Range accruals under spotlight as Taiwan prepares for FRTB
Taiwanese banks review viability of products offering options on long-dated rates
Structured products gain favour among Chinese enterprises
The Chinese government’s flagship national strategy for the advancement of regional connectivity – the Belt and Road Initiative – continues to encourage the outward expansion of Chinese state-owned enterprises (SOEs). Here, Guotai Junan International…
Structured notes – Transforming risk into opportunities
Global markets have experienced a period of extreme volatility in response to acute concerns over the economic impact of the Covid‑19 pandemic. Numerix explores what this means for traders, issuers, risk managers and investors as the structured products…
Structured products – Transforming risk into opportunities
The structured product market is one of the most dynamic and complex of all, offering a multitude of benefits to investors. But increased regulation, intense competition and heightened volatility have become the new normal in financial markets, creating…
Increased adoption and innovation are driving the structured products market
To help better understand the challenges and opportunities a range of firms face when operating in this business, the current trends and future of structured products, and how the digital evolution is impacting the market, Numerix’s Ilja Faerman, senior…
Structured products – The ART of risk transfer
Exploring the risk thrown up by autocallables has created a new family of structured products, offering diversification to investors while allowing their manufacturers room to extend their portfolios, writes Manvir Nijhar, co-head of equities and equity…


