
Monthly swaps data review: a day in the life of a swap
As US rate-setters met last month, real-time reporting showed the impact on swaps

Indicative prices for swaps and other over-the-counter derivatives have always been widely available in the market, with firm prices available to those customers that have the intent to trade – but it was difficult or impossible for market participants to know what prices other firms had been getting or giving. That is no longer true and has significant implications.
Buy-side firms, for example, which have traditionally applied relatively fuzzy best-execution policies in the OTC market, can now judge more finely whether they got a good deal or a bad one.
The source of these changes is the Dodd-Frank Act in the US. Since early 2013, swap data repositories (SDRs) have publicly disseminated trade-level data in near real time – every few minutes.
This trade data provides information on the time of execution, the type of product, the price agreed and the size of the trade, as well as further terms that allow more granular analysis and characterisation of the trade. It shows prices in the swap market evolve in a coherent fashion, as market-makers absorb new information – including client orders and enquiries – but also that prices can move rapidly, and gaps can appear. A difference of a few minutes can see the price shift dramatically.
US dollar interest rate swaps
To illustrate, we first need to select specific types of swaps with comparable prices. Let’s do this for the following types:
- Standard fixed-vs-float US dollar swaps with a 10-year maturity, denoted by the Bloomberg ticker symbol of USSW10 – and only those that are cleared and traded on a swap execution facility (Sef), which is virtually the entire population as clearing and Sef execution is mandatory for these instruments.
- Spreadover US dollar swaps in 10-year maturity, denoted by the ticker USSP10, which are swap spreads over US Treasuries.
- Curve/switch and butterfly swaps where one leg is a standard 10-year swap and are denoted by tickers of the form USSA0510 or US051030.
Now let’s look at the trades for a recent active business day, the second day of the recent US rate-setting committee meeting on June 14.
US dollar 10-year swap trades
Plotting each trade’s fixed rate versus execution time, we get this scatter plot.
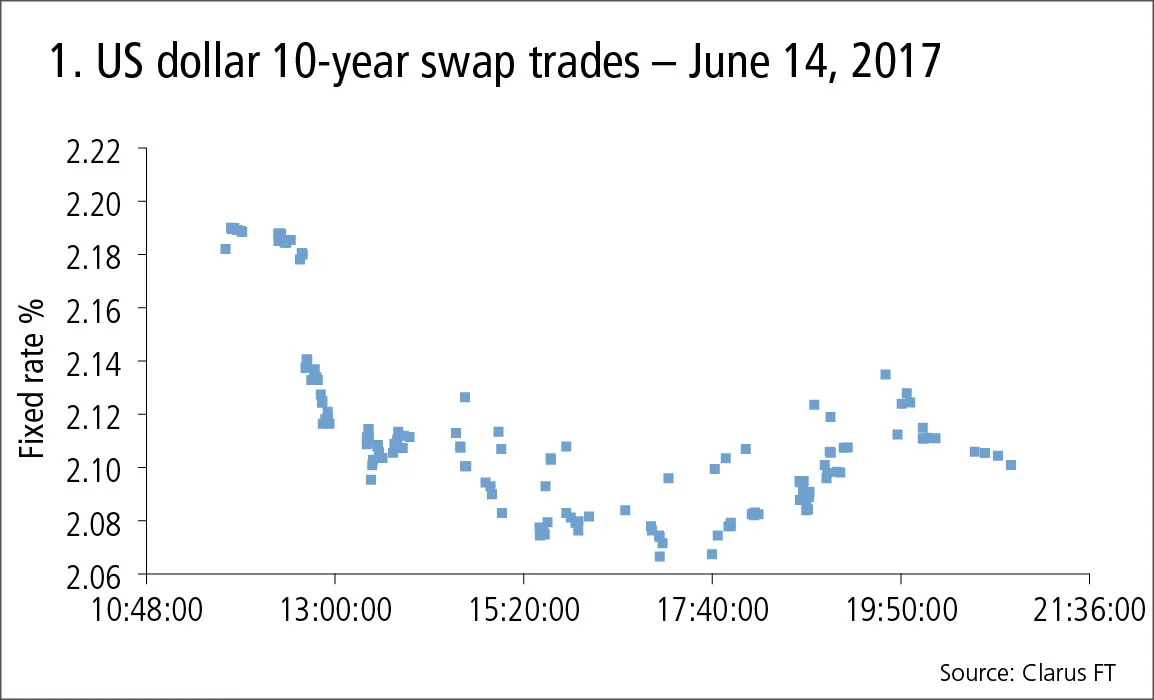
Figure 1 shows:
- Each trade is indicated as a dot print, with times in universal time (UTC), so New York (EDT) is –4 hours.
- The first trades have a fixed rate of 2.195% at 11:45 UTC or 07:45 EDT.
- Between 12:25:15 and 12:31:59, there is a pause in trading, during which prices drop to 2.14%.
- We see the price pattern over the course of the trading day, with the bulk of trades before 15:30 EDT and the last at 6:45:38 pm EDT.
- The 12 dots printed at a consistent level above the main trend line are CME-cleared swaps with trades at a basis spread of +2.5 basis points to LCH-cleared swaps on this date.
- In total, 143 trades in 10-year swaps were executed with an overall gross notional of $5.6 billion; an average trade size of $39 million. In fact, the most common traded size was $50 million, with only two trades above level of $170 million notional – the large-trade threshold beyond which real-time reporting rules are softer, allowing a 15-minute time lag and the full notional not to be disclosed.
US dollar 10-year spreadovers
Next let’s do the same for 10-year spreadovers.
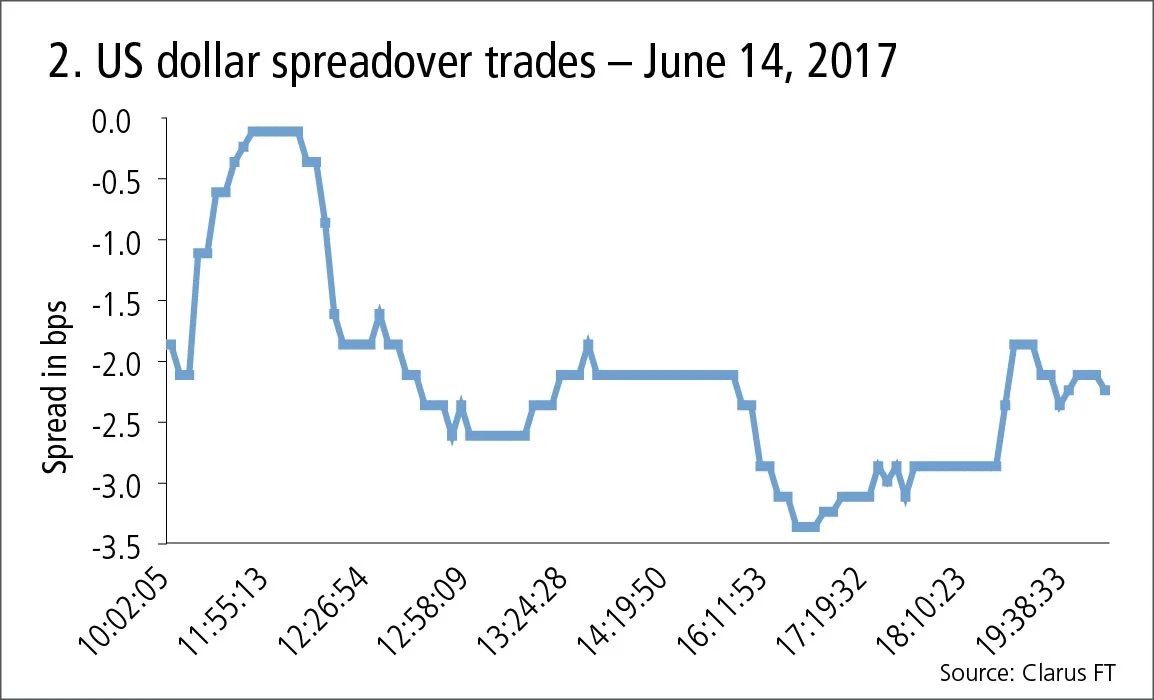
Figure 2 shows:
- The vertical axis is the spread in basis points over US Treasuries.
- Trading gets going at 11:39:10 UTC or 07:39:10 EDT.
- Spreads tighten from –1 bps up to 0 bps, before widening to –2.5 bps.
- We see the price pattern over the course of the trading day, with the last trade at 16:59:07 pm EDT.
- In total, 104 trades in 10-year spreadovers were executed – an overall gross notional of $5.4 billion – with the average and the most common trade size of $50 million.
US dollar curve/switch and butterflies in 10-year
Now let’s create a table of each of these that was traded on June 14, where one leg was in 10-year.
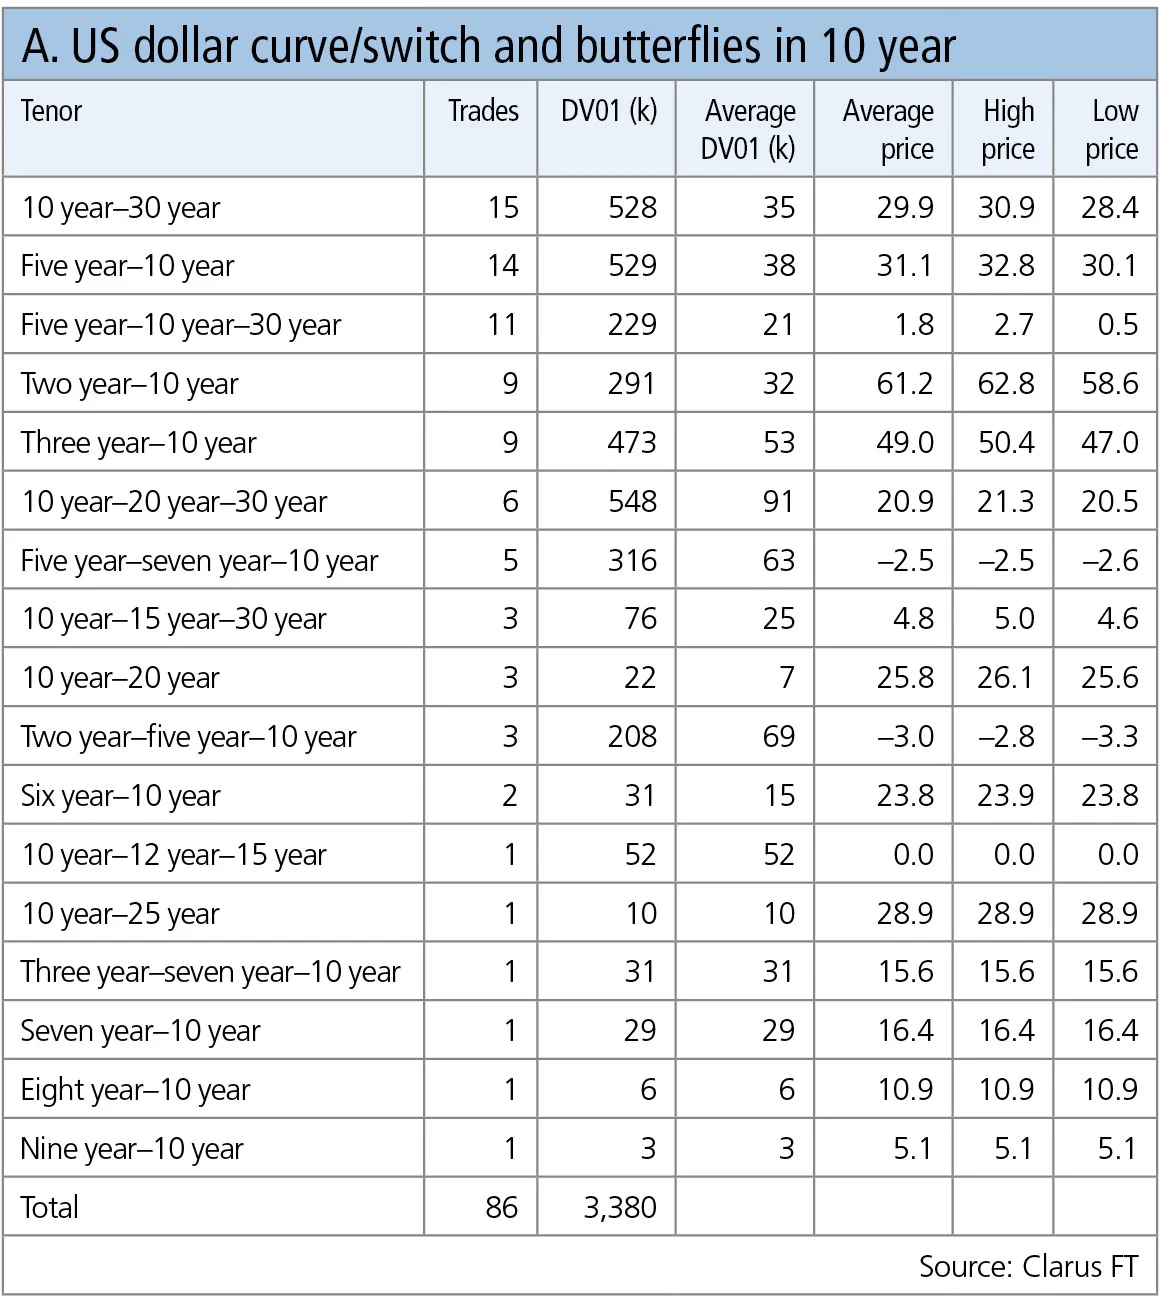
Table A shows:
- 10-year–30-year curve/switch was the most common with 15 trades, a total DV01 of $528,000, an average size of $35,000 DV01, and prices between 28.4bp and 30.9bp.
- Note: DV01 – the per-basis point sensitivity of an interest rate position – is the natural measure for these instruments. Notional raises the question of which leg’s notional to use.
- Five-year–10-year curve/switches are the next most common with 14 trades.
- Five-year–10-year–30-year butterflies are next with 11 trades, a total DV01 of $229,000 and prices from 0.5bps to 2.7bp.
In total 86 trades, or a total of 197 trade legs, were traded with one leg in 10-year. These represented gross DV01 risk of $3.38 million (or $4.5 billion if we sum 10-year leg notionals).
The 10-year swap notional of $5 billion above is equivalent to approximately $5 million of DV01, so the risk traded in curves/switches and butterflies is very significant and comparable in size to that traded in 10-year swaps or 10-year spreadovers.
Swap execution facilities
In the preceding sections, we have taken the trade-level data publicly disseminated by SDRs to look at prices and volume for those trades executed on Sef platforms.
Sefs themselves publish end-of-day instrument-level volumes, so it is interesting to take these for 10-year swaps to see on which platforms activity takes place. Let’s do so for June 14, 2017.
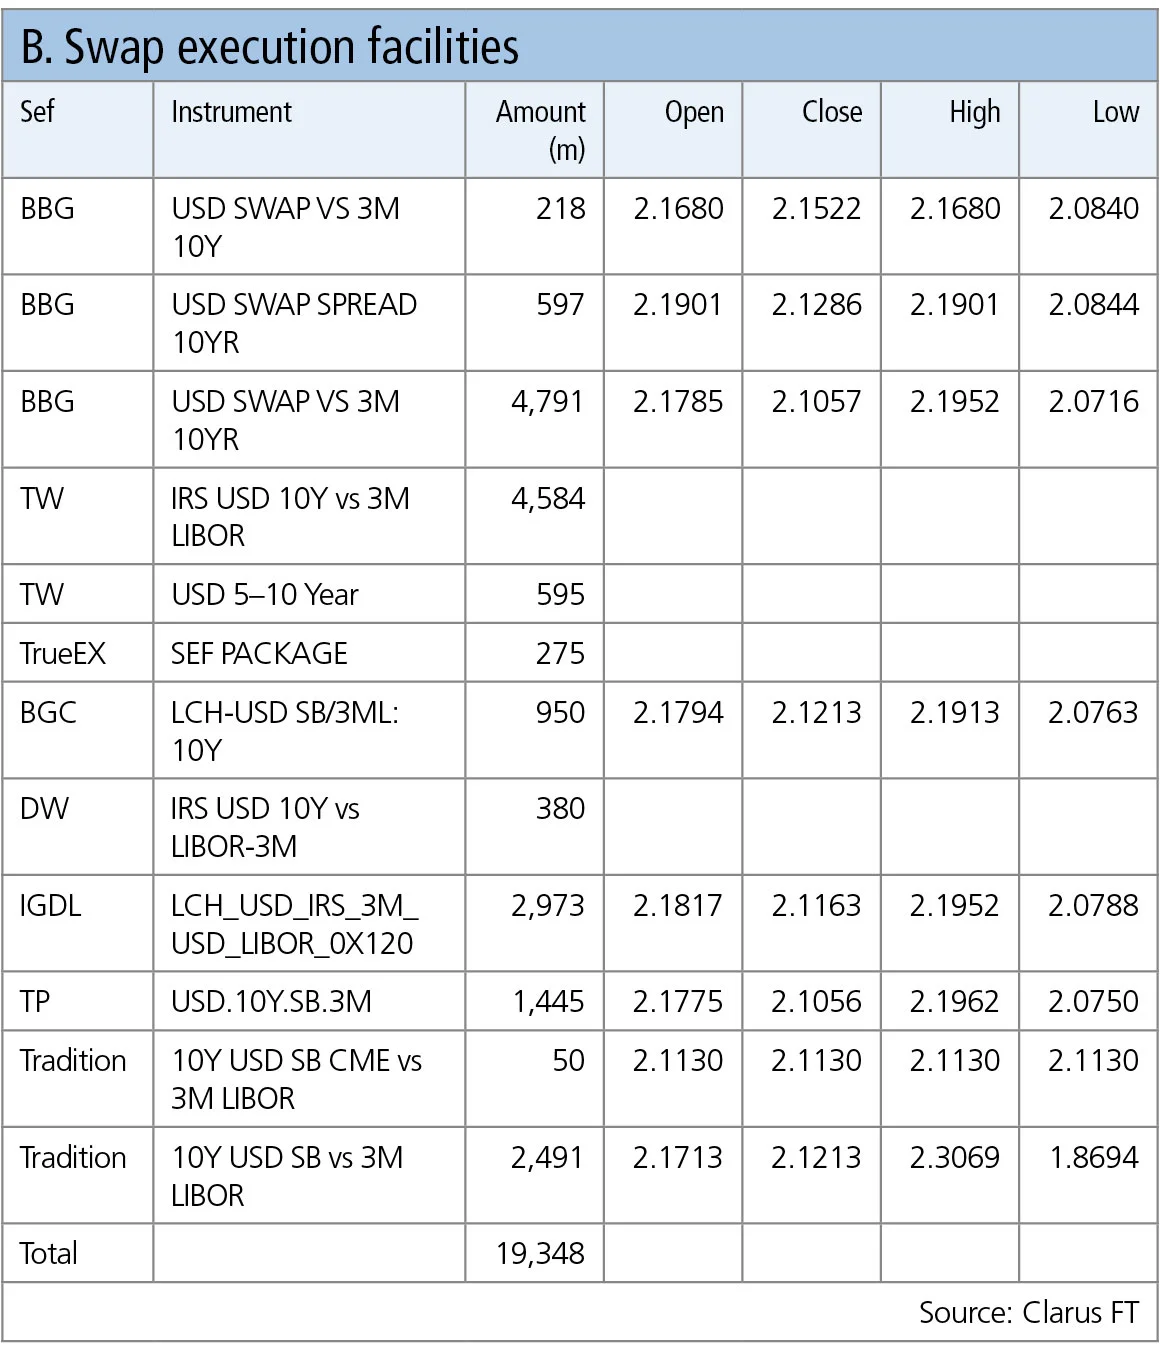
Table B shows:
- Each Sef has an instrument description to report its volume – taking those we know are for 10-year, we see the amounts as reported above.
- In addition, most Sefs show prices as open, close, high and low for the day.
- Sefs also amalgamate all curves/switches and butterfly legs into the same instrument as 10-year swaps or spreadovers.
- An overall amount of $19.3 billion is reported by these Sefs.
- This compares with the $5.6 billion of 10-year swaps, $5.4 billion of 10-year spreadovers and $4.5 billion of curves/switches and butterflies, giving a total of $15.5 billion.
- Bloomberg, Tradeweb and TrueEx figures also include Sef compression volume, which is treated as non-price-forming and were not included in the prior sections; this was $760 million.
- In addition there was $900 million of spreadovers traded as curve/switches against five year, seven year or 30 year.
- The remaining $1 billion difference is from the operation of capped notional rules in SDR data that do not disclose notionals of above $170 million for single trades.
The Sef data provides further insight into the volumes traded on each Sef platform and the price ranges for each trading day. This can help market participants understand where liquidity is and which execution venues they should be using. It will greatly help in upcoming requirements on best execution and transaction cost analysis for derivatives.
Only users who have a paid subscription or are part of a corporate subscription are able to print or copy content.
To access these options, along with all other subscription benefits, please contact info@risk.net or view our subscription options here: http://subscriptions.risk.net/subscribe
You are currently unable to print this content. Please contact info@risk.net to find out more.
You are currently unable to copy this content. Please contact info@risk.net to find out more.
Copyright Infopro Digital Limited. All rights reserved.
You may share this content using our article tools. Printing this content is for the sole use of the Authorised User (named subscriber), as outlined in our terms and conditions - https://www.infopro-insight.com/terms-conditions/insight-subscriptions/
If you would like to purchase additional rights please email info@risk.net
Copyright Infopro Digital Limited. All rights reserved.
You may share this content using our article tools. Copying this content is for the sole use of the Authorised User (named subscriber), as outlined in our terms and conditions - https://www.infopro-insight.com/terms-conditions/insight-subscriptions/
If you would like to purchase additional rights please email info@risk.net
More on Comment
Op risk data: Tech glitch gives customers unlimited funds
Also: Payback for slow Paycheck Protection payouts; SEC hits out at AI washing. Data by ORX News

Op risk data: Lloyds lurches over £450m motor finance speed bump
Also: JPM trips up on trade surveillance; Reg Best Interest starts to bite. Data by ORX News

Georgios Skoufis on RFRs, convexity adjustments and Sabr
Bloomberg quant discusses his new approach for calculating convexity adjustments for RFR swaps
In a world of uncleared margin rules, Isda Simm adapts and evolves
A look back at progress and challenges one year on from UMR and Phase 6 implementation

Op risk data: Morgan Stanley clocked in block trading shock
Also: HSBC deposit guarantee gaffe; Caixa hack cracked; reg fine insult to cyber crime injury. Data by ORX News

Digging deeper into deep hedging
Dynamic techniques and gen-AI simulated data can push the limits of deep hedging even further, as derivatives guru John Hull and colleagues explain

How AI can give banks an edge in bond trading
Machine learning expert Terry Benzschawel explains that bots are available to help dealers manage inventory and model markets

Op risk data: US piqued by Pictet tax breach
Also: US Bank’s Covid failings; South Korea’s short-selling clampdown. Data by ORX News

Most read
- Top 10 operational risks for 2024
- The American way: a stress-test substitute for Basel’s IRRBB?
- Filling gaps in market data with optimal transport