Credit data: sustainable companies are better credit risks
When credit conditions deteriorate, companies with high ESG scores outperform

The link between sustainable business practices and financial performance is hotly debated.
There is plenty of anecdotal evidence of companies with poor environmental, social and governance (ESG) records – Volkswagen and PG&E, for example – coming a cropper. But establishing a clear statistical correlation between ESG scores and stock returns has proven difficult.
In bond markets, the data is more conclusive.
Credit Benchmark analysed the credit performance of global companies with high and low ESG scores. When credit conditions were deteriorating in the first half of 2016, companies with low ESG scores fared especially poorly – with credit risk increasing by nearly 20%. This compares with a 4.5% increase in credit risk for companies with high ESG scores.
Low ESG companies bounced back strongly after credit trends turned positive in mid-2016, with credit risk among this group dropping by 25% over the past three years. Companies with high ESG scores improved by a more modest 12% over the same period.
Put simply, companies with high ESG scores are more stable credits, with lower downside risks.
Rating distributions tell a similar story. The majority of companies with high ESG scores are rated a or better, and only 7% are non-investment grade. By contrast, a fifth of low ESG companies are rated non-investment grade, and none are rated aaa.
Despite this, bond investors have been slow to embrace ESG strategies. According to Morningstar, open-end funds pursuing sustainable investment strategies had $1.8 trillion of assets globally as of mid-2019. Bond funds accounted for only a fifth of this, roughly $375 billion. The data suggests fixed income investors may be missing a trick.
Global credit industry trends
The latest bank-sourced credit data shows credit activity for corporates and financials has stayed stable, with 4.0% of entities moving by at least one notch, in comparison with 3.9% last month. Figure 1 shows detailed industry migration trends for the most recent published data, adjusted for changes in contributor mix.
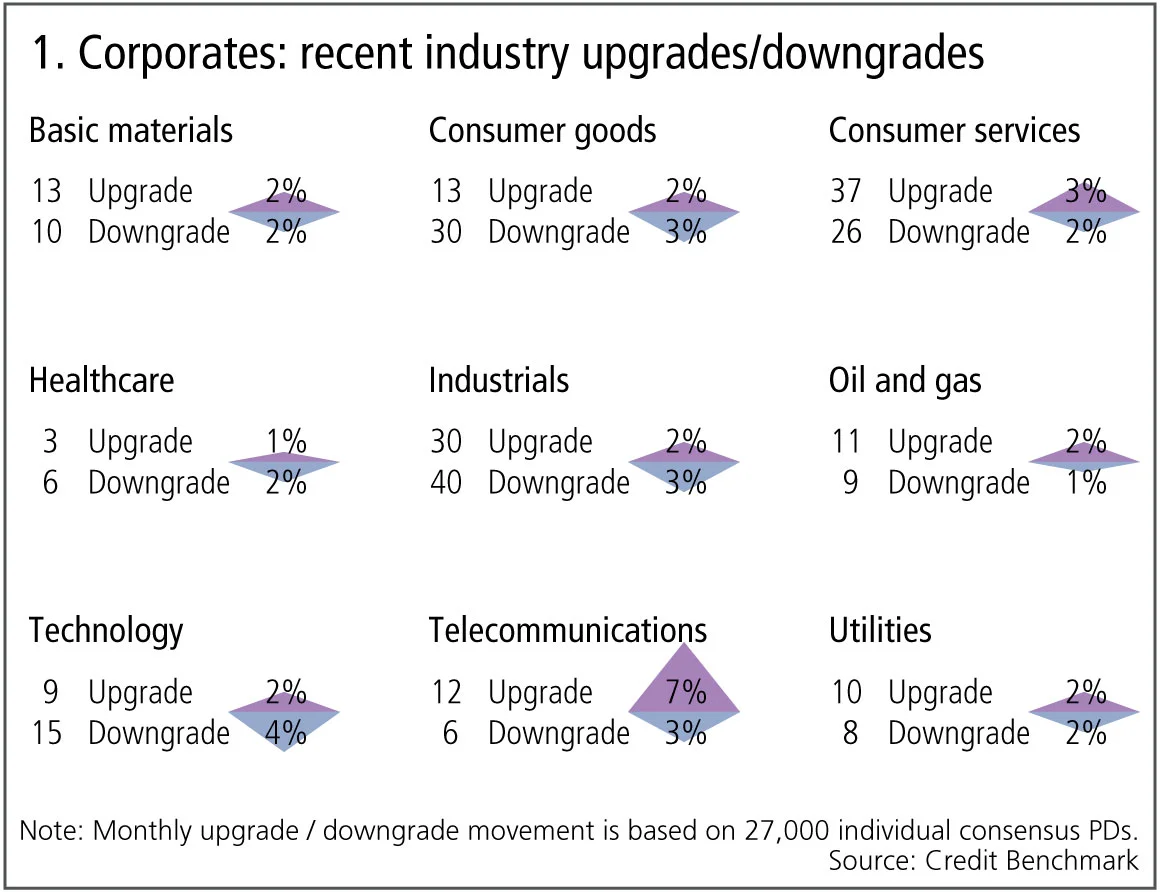
Figure 1 shows:
- Globally, the number of corporate upgrades and downgrades are in -balance.
- Upgrades outnumber downgrades in three of the nine industries, four industries are biased towards downgrades and two are in balance.
- Consumer goods and healthcare return to downgrades dominating after a period of balance.
- Technology sees downgrades outweigh upgrades after two months of upgrades dominating.
- Industrials see downgrades outnumber upgrades for the second month.
- Consumer services see upgrades outweighing downgrades after two months of the opposite.
- Oil and gas and telecommunications see more upgrades than downgrades after a period of balance.
- Basic materials are in balance after one month of -downgrades -dominating.
- Utilities are in balance for the second month.
Credit risk premium
Credit default swap prices and bond yields are often used as proxies for credit default risk. They do, however, have the well-known drawback that they are a risk-neutral measure – they contain a variety of risk premiums that reflect liquidity, hedging costs and short-term credit sentiment. Government bonds are sufficiently liquid that divergences between bond yields and real-world bank-sourced credit risk estimates provide a purer measure of the credit risk premium.
Figure 2 shows the risk premium, calculated using data for 31 government bond markets.
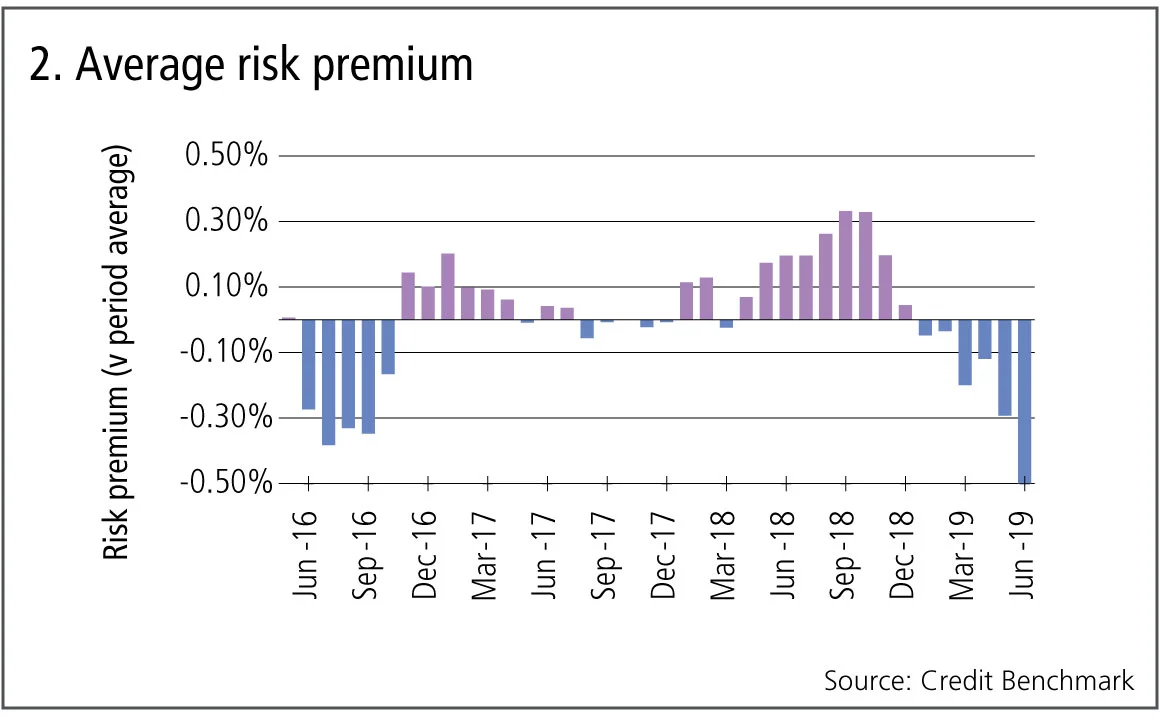
Figure 2 shows:
- The risk premium shows clear cycles.
- During the third quarter of 2016, credit risk premiums were low compared with the average across the time period.
- The risk premium increased towards the end of 2016, and remained mainly above average until the end of 2018.
- The risk premium began dropping in Q3 2018, and is currently at its lowest point in the last three years, suggesting investors are being poorly compensated for taking sovereign credit risk.
US vs UK transition rates
Companies in both the US and the UK are facing increased levels of uncertainty. UK companies are factoring the impact of a no-deal Brexit into their business plans, while US firms work around the growing number of tariffs on Chinese goods. Some of these effects can be tracked in the credit transition matrices based on bank-sourced data. These are shown in figure 3, based on 8,000 US and 13,500 UK large corporates.
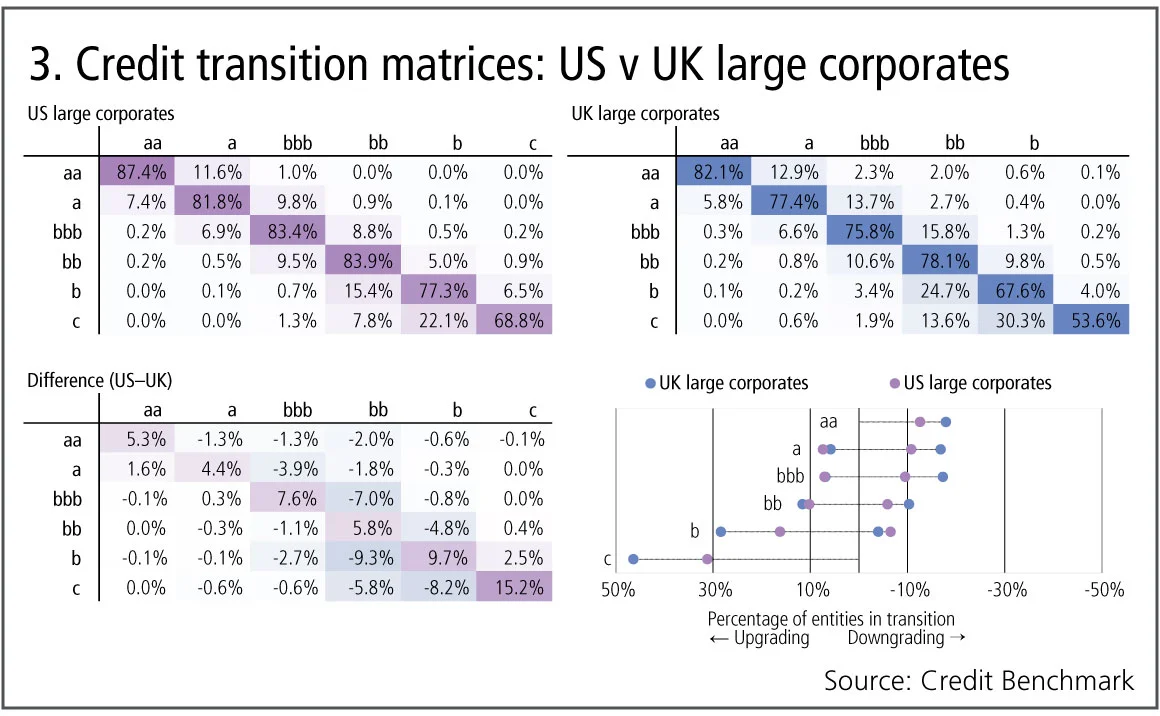
Figure 3 shows:
- US large corporates are more stable, with the average no-transition rate of 80% compared with 72% for UK large corporates.
- UK corporates show significantly higher percentage downgrades in categories aa, a, bbb and b while upgrade rates in these categories remain comparable across the two regions.
- Focusing on the investment-grade/high-yield boundary, the upgrade rate from bb to bbb is higher than the downgrade rate from bbb to bb for US corporates. The bbb to bb downgrade rate is 1.5 times higher than the bb to bbb upgrade rate for UK corporates.
- Corporates in low high-yield categories (b, c) experience more significant upgrade rates in the UK than in the US.
Credit risk and ESG scores
ESG assessments are becoming increasingly important in investment processes.
Figure 4 shows the credit trend and distribution for two groups of borrowers: 116 global companies with ‘high’ ESG scores (65 or more) and 97 with ‘low’ ESG scores (less than 20). Companies with low ESG scores are judged to be less environmentally protective, less diverse or socially inclusive, and/or have fewer checks and balances around corporate governance. The ESG scores used here are provided by Legal & General Investment Management (LGIM).
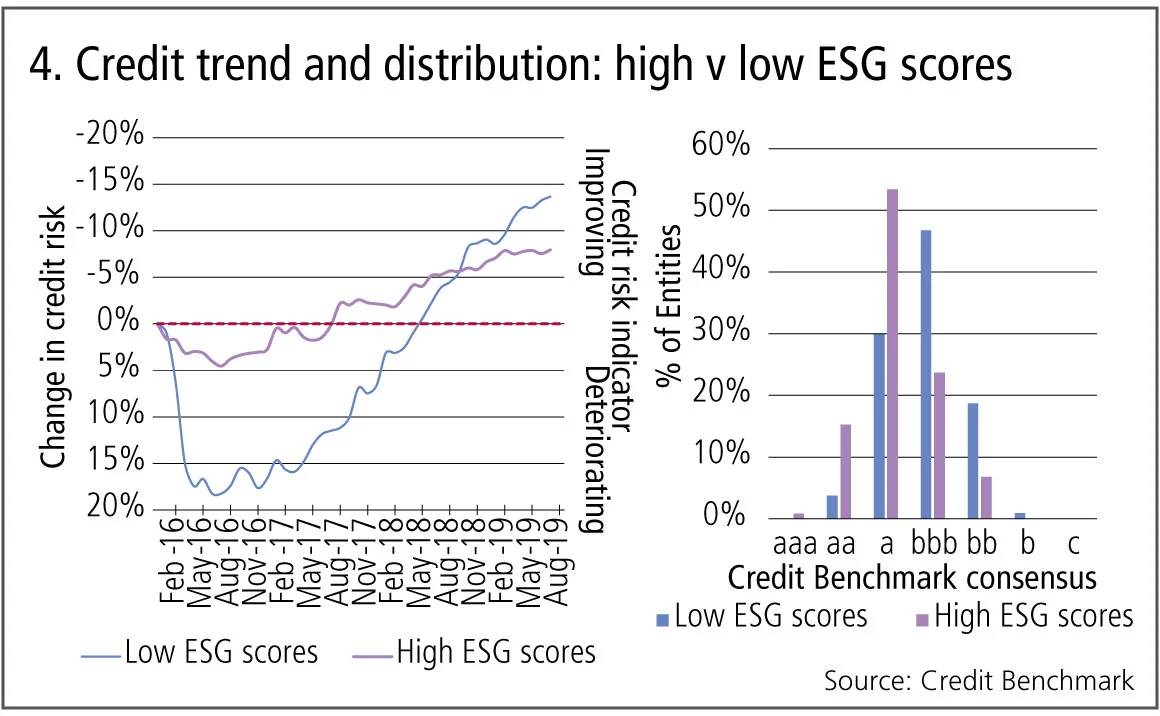
Figure 4 shows:
- Both groups show deteriorating credit in the first half of 2016. This is significantly steeper and deeper for borrowers with low ESG scores, where credit risk increased by nearly 20% in the first half of 2016. Over the same period, borrowers with high ESG scores show a modest 4.5% risk increase.
- Since mid-2016, the credit risks of both high- and low-scoring companies has improved. Low ESG companies have seen a particularly rapid improvement in credit, with risk dropping by more than 25% since July 2016. High ESG companies have also improved somewhat, with risk dropping by 12% over the same period.
- The credit distributions show a clear difference between high ESG and low ESG borrowers. More than half of the high ESG companies are in category a, with only 7% in non-investment-grade categories. The majority of low-scoring companies are in the bbb category with 20% in non-investment-grade categories. There are no low ESG borrowers in the aaa category, and no high ESG borrowers are in the b or c categories. Companies with high ESG scores are typically better credit risks.
Large-cap v small-cap companies
With continuing trade tensions, it is useful to compare the performance of international and domestic companies. A well-known US indicator for this is the relationship between the S&P 500 and Russell 2000 indexes. The S&P 500 represents large multinational companies and is strongly correlated with the global economy; the smaller, more volatile businesses in the Russell 2000 are more dependent on domestic trends.
Figure 5 shows recent credit trends of 450 large-cap and 700 small-cap US companies, all of which are members of the S&P 500 and Russell 2000 indexes, respectively.
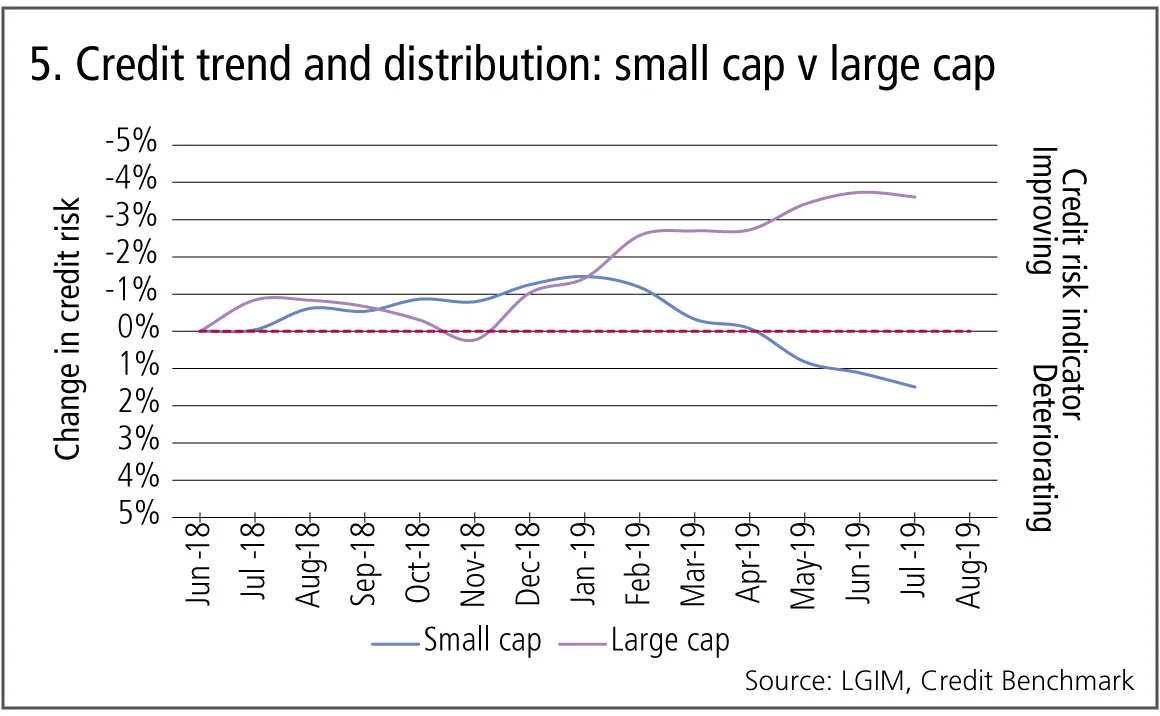
Figure 5 shows:
- The credit risk trends of both the small-cap and large-cap companies were aligned in 2018, but started to diverge at the beginning of 2019.
- The credit risk of small-cap companies increased by 3% in the first six months of 2019, whereas large-cap credit risk decreased by 2% in the same time period.
- The latest data, however, shows large-cap company credit risk increasing, aligned with the trend that has been seen in small-cap companies since January 2019.
About this data
Credit Benchmark collects monthly credit risk inputs from 40-plus of the world’s leading financial institutions, making it possible to follow credit trends across geographies and industries. In all, the dataset contains consensus ratings on about 50,000 rated and unrated entities globally.
David Carruthers is head of research at Credit Benchmark.
Only users who have a paid subscription or are part of a corporate subscription are able to print or copy content.
To access these options, along with all other subscription benefits, please contact info@risk.net or view our subscription options here: http://subscriptions.risk.net/subscribe
You are currently unable to print this content. Please contact info@risk.net to find out more.
You are currently unable to copy this content. Please contact info@risk.net to find out more.
Copyright Infopro Digital Limited. All rights reserved.
You may share this content using our article tools. Printing this content is for the sole use of the Authorised User (named subscriber), as outlined in our terms and conditions - https://www.infopro-insight.com/terms-conditions/insight-subscriptions/
If you would like to purchase additional rights please email info@risk.net
Copyright Infopro Digital Limited. All rights reserved.
You may share this content using our article tools. Copying this content is for the sole use of the Authorised User (named subscriber), as outlined in our terms and conditions - https://www.infopro-insight.com/terms-conditions/insight-subscriptions/
If you would like to purchase additional rights please email info@risk.net
More on Comment
Op risk data: Tech glitch gives customers unlimited funds
Also: Payback for slow Paycheck Protection payouts; SEC hits out at AI washing. Data by ORX News

Op risk data: Lloyds lurches over £450m motor finance speed bump
Also: JPM trips up on trade surveillance; Reg Best Interest starts to bite. Data by ORX News

Georgios Skoufis on RFRs, convexity adjustments and Sabr
Bloomberg quant discusses his new approach for calculating convexity adjustments for RFR swaps

In a world of uncleared margin rules, Isda Simm adapts and evolves
A look back at progress and challenges one year on from UMR and Phase 6 implementation

Op risk data: Morgan Stanley clocked in block trading shock
Also: HSBC deposit guarantee gaffe; Caixa hack cracked; reg fine insult to cyber crime injury. Data by ORX News

Digging deeper into deep hedging
Dynamic techniques and gen-AI simulated data can push the limits of deep hedging even further, as derivatives guru John Hull and colleagues explain

How AI can give banks an edge in bond trading
Machine learning expert Terry Benzschawel explains that bots are available to help dealers manage inventory and model markets

Op risk data: US piqued by Pictet tax breach
Also: US Bank’s Covid failings; South Korea’s short-selling clampdown. Data by ORX News