Credit data: more trouble in the oil and gas pipeline
US self-sufficiency in oil could be bad news for shale producers

Oil and gas lenders tend to be a stoic bunch. But even the hardiest among them could be forgiven for feeling rattled these days.
The Trump administration’s talk of slapping tariffs on major producers such as Iran, Mexico and Venezuela might play well to his political base, but it plays merry hell with prices and shakes confidence in the global supply chain. And while the US and its allies in the Middle East have stopped short of explicitly accusing Iran of orchestrating the recent sabotage attacks on United Arab Emirates tankers, they have made plain via briefings where they believe the blame lies.
Such tensions are reflected in recent price action. Brent crude has risen by a fifth in the past few months, see-sawing between just below $50 a barrel and as high as $86.74 in a wide 52-week range.
But the sabre-rattling belies strong fundamentals. On paper, the supply side looks strong: US shale oil production is in rude health – to the extent the US is now energy self-sufficient – with more improving credits among producers than deteriorating ones for more than two years straight. Meanwhile, the Organization of the Petroleum Exporting Countries has opened the taps on Middle East crude supply to record levels.
In the medium term, though, supply-side strength could have a negative effect on the credit quality of borrowers betting on high prices. The net balance between improvements to deteriorations began to decline in October 2018. In March 2019, it turned negative, and the data suggests more difficult times are in the pipeline.
Elsewhere this month, we run the rule over the deteriorating credit outlook for highly indebted US and UK companies – those with debt-to-enterprise value ratios in excess of 75% – and Canada’s industrials sector.
Global credit industry trends
The latest bank-sourced credit data, based on 30-plus financial institutions, shows upgrade and downgrade activity has remained stable, with 43 companies moving more than one notch, compared with 39 companies the previous month. Figure 1 shows detailed industry migration trends for the most recent published data, based on data adjusted for changes in contributor mix.
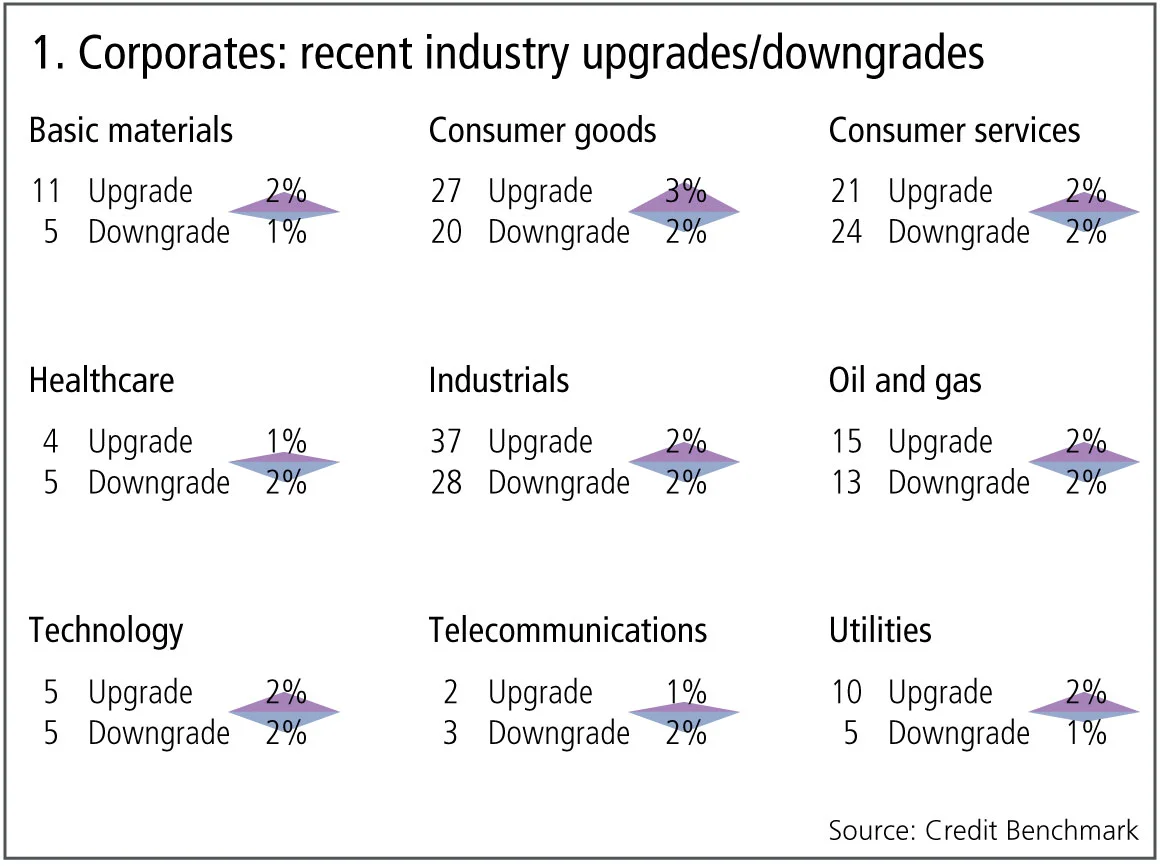
Figure 1 shows:
- Globally, the number of corporate upgrades and downgrades are in balance.
- Upgrades outnumber downgrades in three of the nine industries, two industries are biased towards downgrades and four are in balance.
- Basic materials and utilities continue their half-year trend of upgrades dominating.
- Consumer goods see upgrades outweighing downgrades for the second month.
- Telecommunications return to downgrades outweighing upgrades after a month of balance.
- Healthcare is volatile, with downgrades now dominating.
- Technology returns to balance after a month of upgrades outnumbering downgrades.
- Industrials are in balance after downgrades previously outweighed upgrades.
- Consumer services continue to be in balance for a second month.
Canadian industries
Canada’s economy faces sluggish growth this year, despite continued job creation. The 2016 ‘Robin Hood’ fiscal package boosted middle-class spending power, but trade tensions have had a negative impact on business confidence. Canada has recently concluded a series of strong trade deals – with the EU, with Asia (ex-China) and most importantly with the US – but it also has major exposure to global resource industries.
The chart shows the changes in credit risk of nine Canadian industries since December 2015.
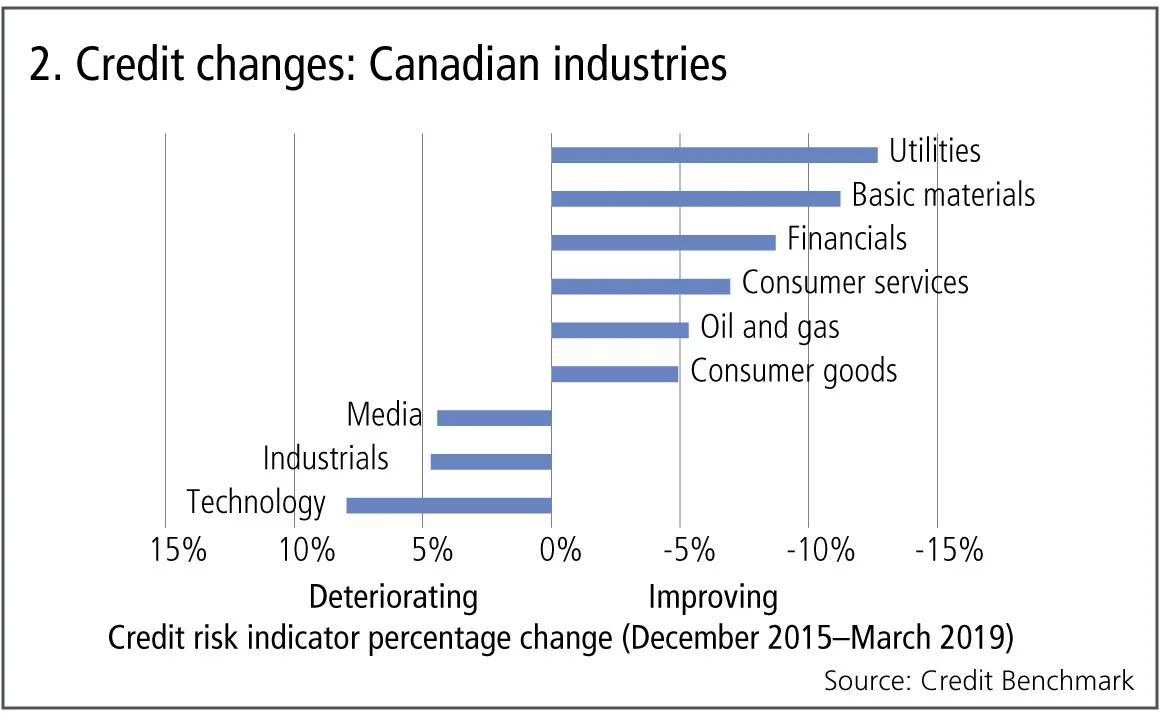
Figure 2 shows:
- Six of the nine Canadian industries have shown an improvement in credit risk since December 2015.
- Utilities and basic materials have had the largest improvements, with decreases in credit risk of 13% and 11%, respectively.
- Consumer services and consumer goods have been stronger than in most economies, reflecting the 2016 tax cuts aimed at restoring middle-class purchasing power.
- Technology, industrials and media are the three industries that have seen a deterioration in credit risk, dropping by 8%, 5% and 4%, respectively.
US oil and gas
Tension between the US and Iran has resulted in a fresh bout of volatility for the global oil industry. The US oil and gas sector has so far seen a major recovery from the lows of 2016–17; shale output continues to grow and the US is now self-sufficient in energy. According to the US Energy Information Administration, 2018 was the most profitable year for US oil producers since 2013. Growing political risks – in Venezuela and Libya as well as Iran – have pushed the price to short-term highs. But these are likely to be temporary, with shale acting as a long-term dampener on the oil price and credit data suggests more difficult times are in the pipeline.
Figure 3 shows the credit trend and activity of 460 US oil and gas companies.
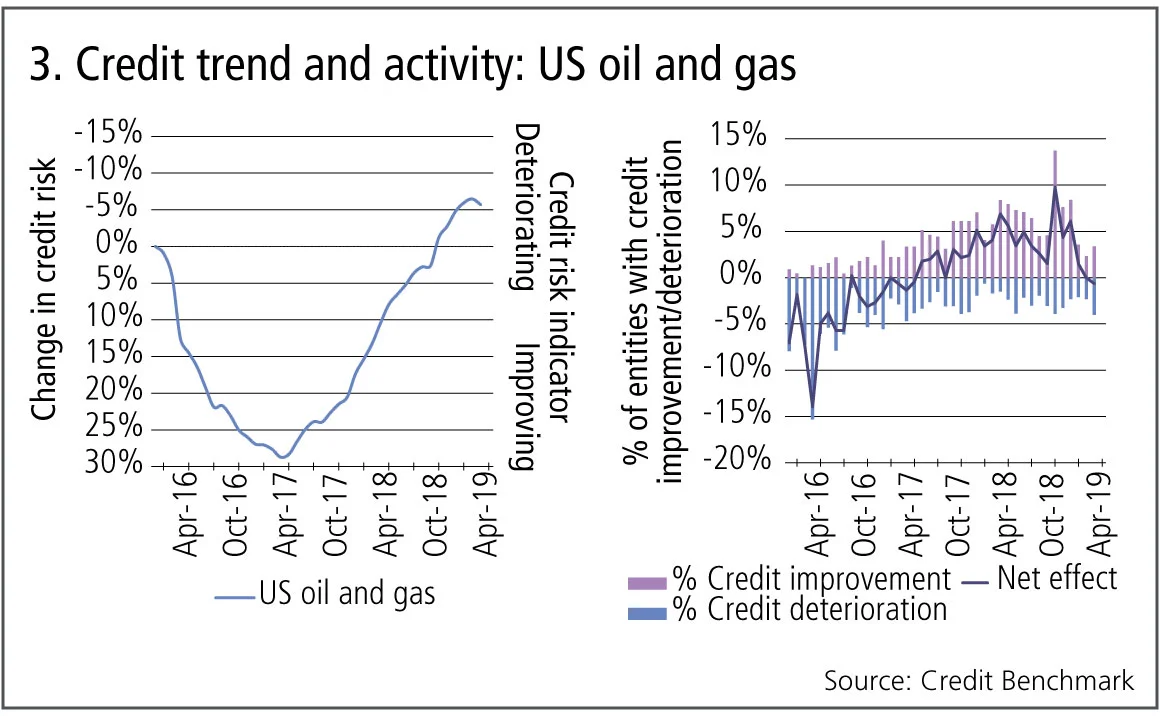
Figure 3 shows:
- April 2017 was the main turning point in the US oil and gas credit trend, preceded by a change in the net effect of improvements and deteriorations. The balance moved into positive territory in mid‑2017.
- The industry recovered and surpassed its December 2015 credit level in October 2018.
- Since October 2018 there are early signs of a new, negative, turning point emerging. At that point, the net balance between improvements to deteriorations began to decline after reaching a short-term peak. In March 2019, it turned negative.
BBB credit risk
Concerns about the scope for increased defaults and a possible increase in credit spreads has led to further scrutiny of the large number of North American corporate bonds in the BBB category. But bank-sourced credit data has previously shown a traditional bell curve distribution for corporates borrowing directly from banks. There may be more scope for “fallen angels” in the BBB area, but that is usually the case anyway. In addition, the BBB category contains a number of disparate sectors with their own credit cycles and trends; these are reflected in credit transition matrices.
Figure 4 summarises recent patterns in bbb transitions for a number of North American industries, based on annual (January 2018 to January 2019) credit transition matrices of at least 2,000 observations.
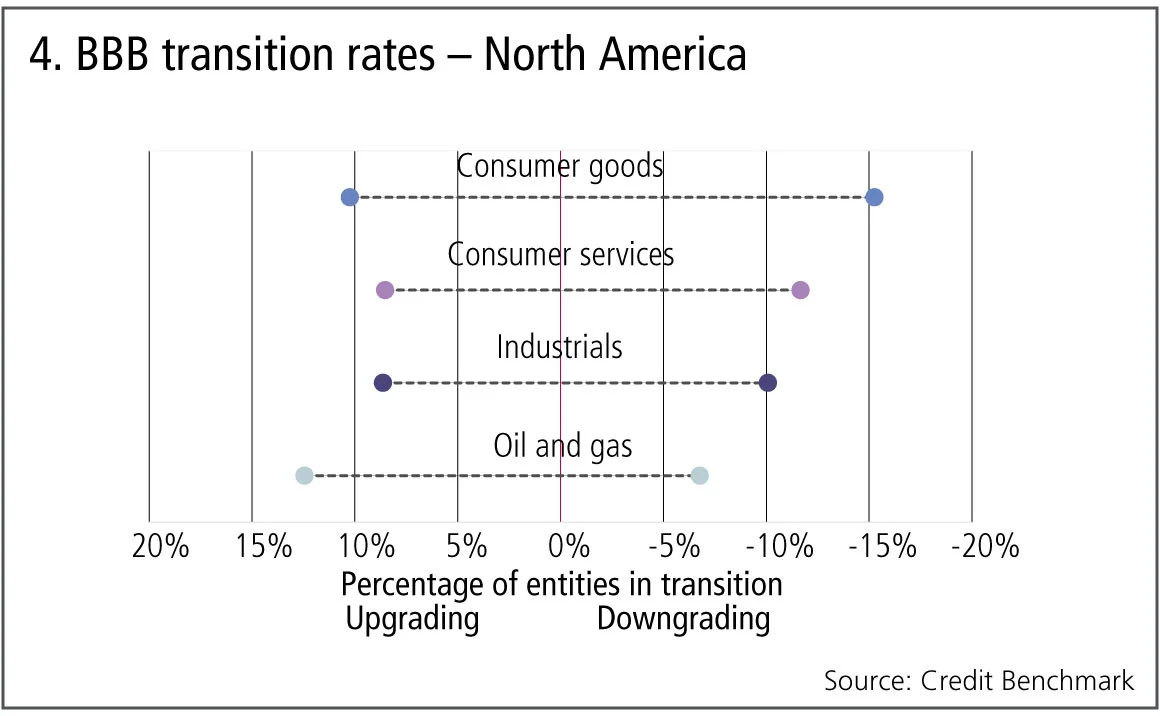
Figure 4 shows:
- North American consumer goods borrowers in the bbb category are the most likely to downgrade, with a downgrade rate 1.3 times higher than for consumer services and 2.2 times higher than for oil and gas in the same credit category.
- The same group of North American consumer goods borrowers also show the highest bias towards downgrades, with 50% more entities downgraded than upgraded.
- The North American consumer goods industry shows the highest proportion of transitions overall, with more than a quarter (26%) of all entities downgraded or upgraded. The average for the other industries is 20%.
- North American oil and gas is the only industry showing a positive bias, with 50% more of the bbb entities upgrading than downgrading.
This is in stark contrast to the overall pattern for US oil and gas reported in the previous section; the potential negative turning point identified has yet to appear in this credit category across all North American firms, which include the large Canadian and Mexican sectors.
High-debt v low-debt companies
Concerns about a possible rise in default rates has brought renewed focus on heavily indebted companies. It seems intuitive that weaker balance sheets will be the main factor in lower credit ratings, but this section looks at regional comparisons. Low-debt companies are defined as those with debt to enterprise value ratios of less than 10%; high debt are those with ratios in excess of 75%.
Figure 5 compares the credit changes and levels of high-debt and low-debt companies in US, EU ex-UK and UK.
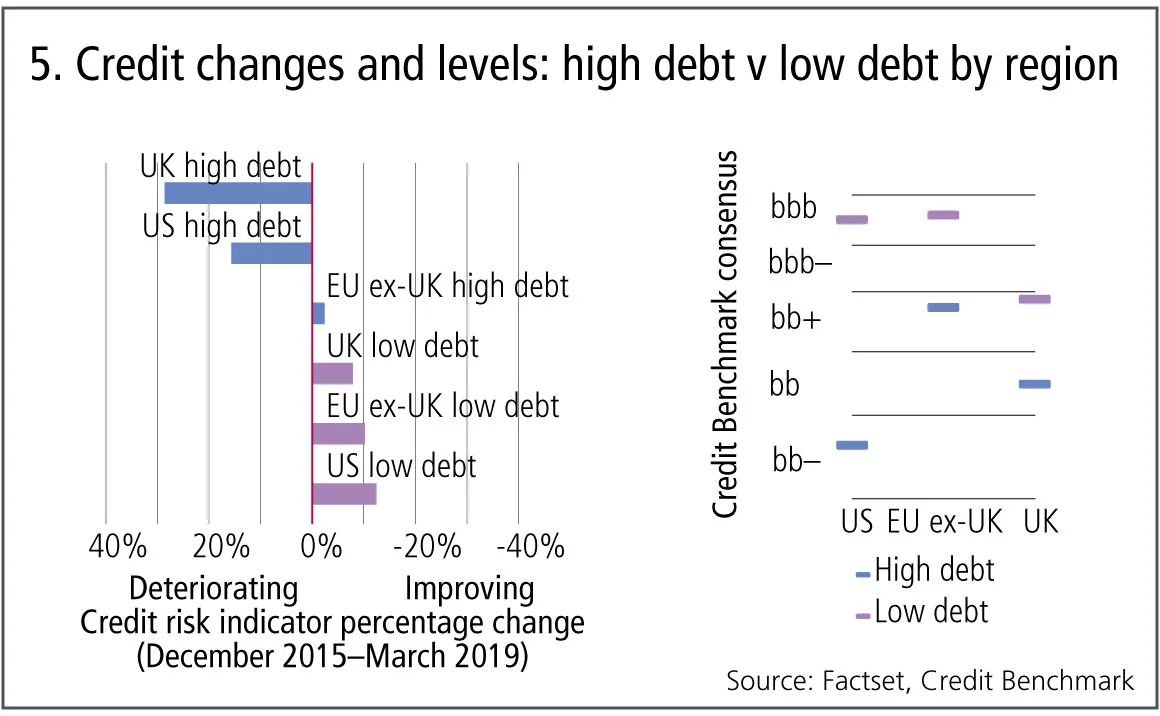
Figure 5 shows:
- Low-debt companies in the US, EU ex-UK and UK all show credit risk improvements since December 2015. US low-debt companies show the largest improvement (12%).
- EU ex-UK is the only region where high-debt companies show improving credit risk.
- High-debt companies in the UK show the highest deterioration in credit risk, with a 30% drop since December 2015.
- The levels of credit risk for low-debt firms in the US and EU ex-UK are similar, with averages in the bbb category. By contrast, even UK low-debt companies are non-investment grade, at a level similar to that of high-debt companies in EU ex-UK.
- US high-debt companies have the highest credit risk with averages in the bb– category.
About this data
Credit Benchmark provides the world’s most comprehensive market view of credit risk. By bringing together monthly credit risk inputs from 40-plus of the world’s leading financial institutions, Credit Benchmark provides credit trends across geographies and industries as well as a unique view of credit risk with consensus ratings on about 50,000 rated and unrated entities globally.
David Carruthers is head of research at Credit Benchmark.
Only users who have a paid subscription or are part of a corporate subscription are able to print or copy content.
To access these options, along with all other subscription benefits, please contact info@risk.net or view our subscription options here: http://subscriptions.risk.net/subscribe
You are currently unable to print this content. Please contact info@risk.net to find out more.
You are currently unable to copy this content. Please contact info@risk.net to find out more.
Copyright Infopro Digital Limited. All rights reserved.
You may share this content using our article tools. Printing this content is for the sole use of the Authorised User (named subscriber), as outlined in our terms and conditions - https://www.infopro-insight.com/terms-conditions/insight-subscriptions/
If you would like to purchase additional rights please email info@risk.net
Copyright Infopro Digital Limited. All rights reserved.
You may share this content using our article tools. Copying this content is for the sole use of the Authorised User (named subscriber), as outlined in our terms and conditions - https://www.infopro-insight.com/terms-conditions/insight-subscriptions/
If you would like to purchase additional rights please email info@risk.net
More on Comment
Op risk data: Tech glitch gives customers unlimited funds
Also: Payback for slow Paycheck Protection payouts; SEC hits out at AI washing. Data by ORX News

Op risk data: Lloyds lurches over £450m motor finance speed bump
Also: JPM trips up on trade surveillance; Reg Best Interest starts to bite. Data by ORX News

Georgios Skoufis on RFRs, convexity adjustments and Sabr
Bloomberg quant discusses his new approach for calculating convexity adjustments for RFR swaps

In a world of uncleared margin rules, Isda Simm adapts and evolves
A look back at progress and challenges one year on from UMR and Phase 6 implementation

Op risk data: Morgan Stanley clocked in block trading shock
Also: HSBC deposit guarantee gaffe; Caixa hack cracked; reg fine insult to cyber crime injury. Data by ORX News

Digging deeper into deep hedging
Dynamic techniques and gen-AI simulated data can push the limits of deep hedging even further, as derivatives guru John Hull and colleagues explain

How AI can give banks an edge in bond trading
Machine learning expert Terry Benzschawel explains that bots are available to help dealers manage inventory and model markets

Op risk data: US piqued by Pictet tax breach
Also: US Bank’s Covid failings; South Korea’s short-selling clampdown. Data by ORX News