Credit data: UK banks hold firm as Brexit looms
The credit status of UK banks remains unchanged, but other industries have seen significant deterioration

The UK’s bumpy Brexit joyride has left London’s financial firms on edge. UK banks have set aside more than half a billion pounds to cover Brexit-related credit losses. Liquidity buffers have been reinforced, to the tune of £53 billion, at the insistence of the Bank of England. Assets are being shifted to the European Union, en masse.
The credit market’s reaction to all this falls somewhere between sanguine and sleepy.
Since the UK voted to leave the European Union in June 2016, the credit status of UK financials has barely changed. That may seem surprising, but it suggests banks can limit any Brexit damage, and is consistent with the views of regulators and rating agencies.
The Bank of England’s 2018 stress tests, the result of which were published on November 28, found that UK banks had sufficient capital and liquidity to withstand a disruptive Brexit.
Moody’s agrees. In a February 27 report, the rating agency said it expected UK banks to weather any disruption.
And on March 26, Elke König, head of the European Union’s Single Resolution Board, said she saw “no imminent risks to financial stability” in a no-deal Brexit.
The banking sector is the exception, not the rule. The credit status of other large UK industries has turned sharply negative since the referendum. Consumer services and industrials have seen the largest downgrades, with only telecommunications showing any material improvement.
Also this month, we look at recent data on US large financials, compare tax revenues with sovereign credit risk, and review the US corporate credit distributions for bank borrowers, rated issuers and bond issues.
Global credit industry trends
The latest bank-sourced credit data, based on 30-plus financial institutions, shows upgrade and downgrade activity has slightly increased, with 62 companies moving more than one notch.
Figure 1 shows detailed industry migration trends for the most recent published data, based on data adjusted for changes in contributor mix.
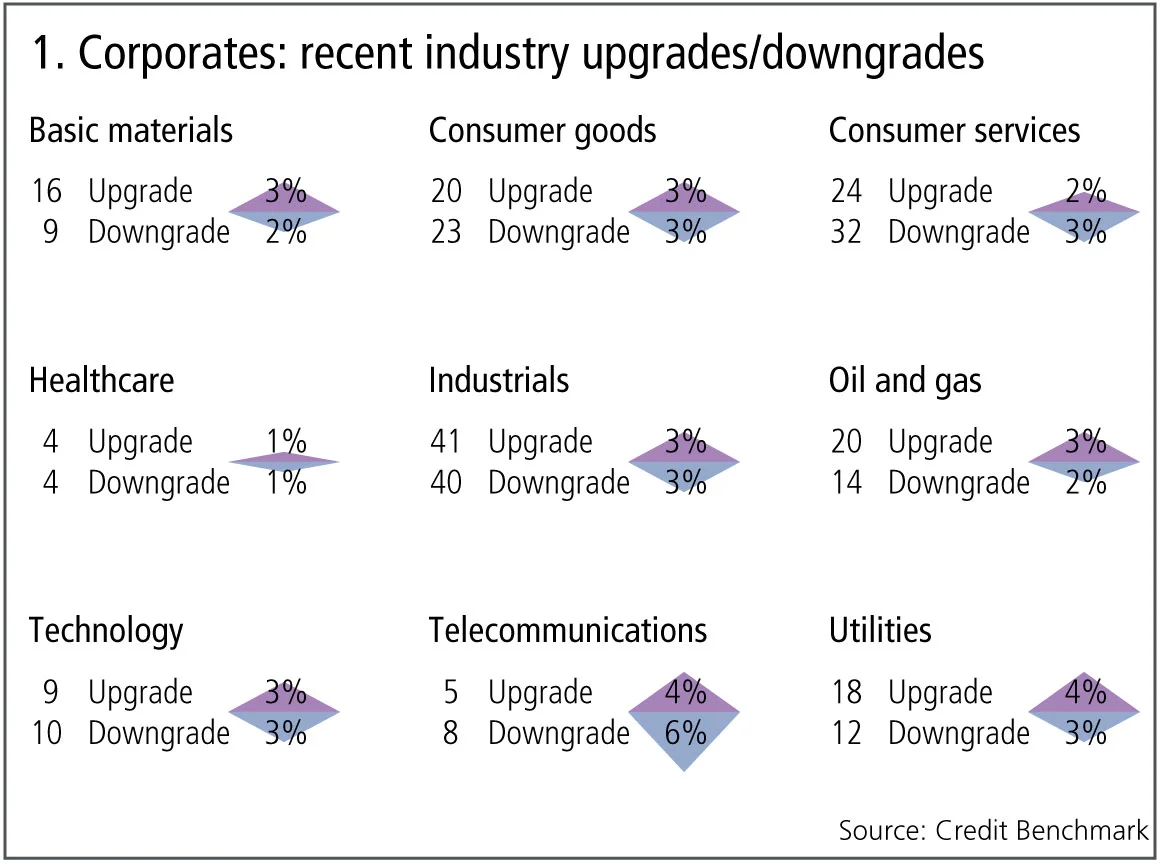
Figure 1 shows:
- Across global corporates, the number of upgrades and downgrades are in balance.
- Upgrades dominate downgrades in three of the nine industries and two industries are biased towards downgrades.
- Basic materials return to upgrades outweighing downgrades after a period of balance.
- Oil and gas upgrades outnumber downgrades for the third month.
- Utilities continue the five-month trend of upgrades favouring downgrades.
- Consumer services see downgrades dominating upgrades for the third consecutive month.
- For the fourth month, telecommunications have more downgrades than upgrades.
- Consumer goods continue to see a balance between upgrades and downgrades for the third month.
- Technology is now in balance after two months of upgrades outweighing downgrades for two months.
- Healthcare and industrials show some volatility in trends, with both now showing balance between upgrades and downgrades.
US large financials v corporates
The Trump administration has had a modest but notable impact on the credit status of US companies. Deregulation and rising rates have created expectations of a new ‘golden age’ for US banking. But trade wars and competition for deposits have put the brakes on balance sheet expansion. However, tax cuts and the America First trade policy have been positive for many traditional corporates, although recent trade figures show the trade tensions are unlikely to abate soon.
Figure 2 shows credit changes for large US corporates and financials.
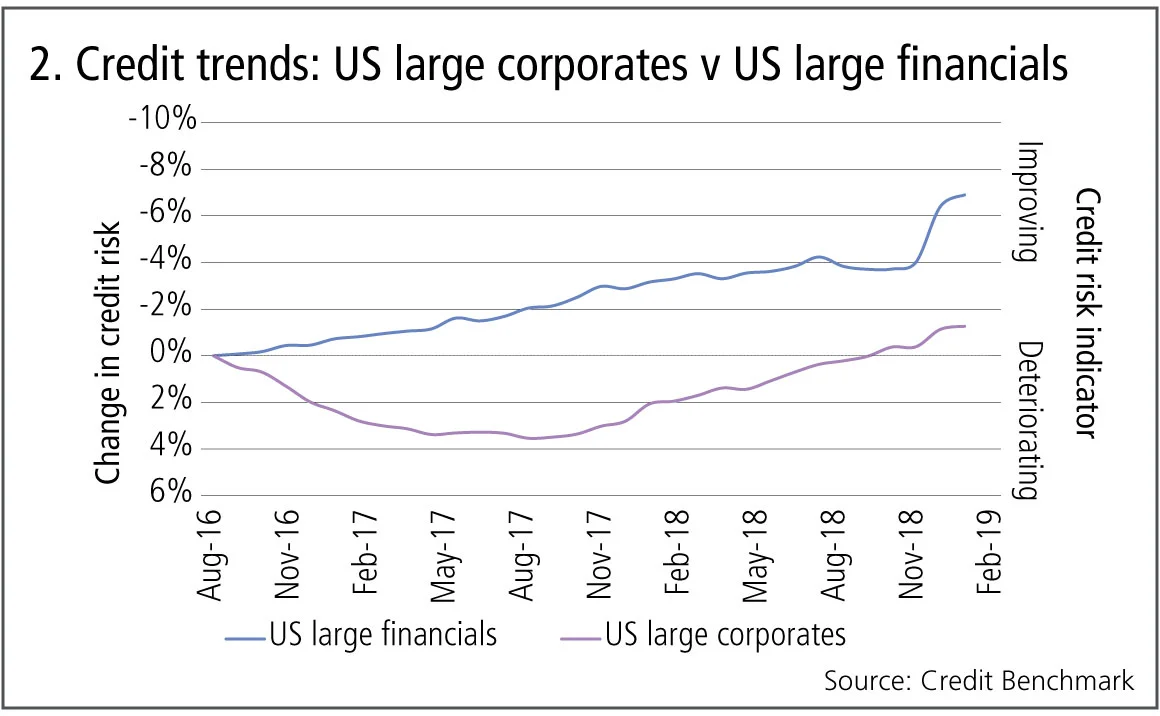
Figure 2 shows:
- US financials improved steadily between mid-2016 and mid-2018. Credit stabilised in the latter half of 2018 and has since shown further improvement.
- US corporate credit declined rapidly between mid-2016 and mid‑2017.
- Since mid-2017, US corporate credit has steadily improved.
- The cumulative changes in credit risk for these two large groups were converging, but financials have recently pulled ahead.
UK large industries
The bank consensus shows a strongly negative view of UK industry credit risk in the aftermath of the Brexit referendum. Growing uncertainty about the UK’s trade status in 2019 appears to be the main driver, but the pattern of downgrades since July 2016 gives some clues to the expected impact by industry.
Figure 3 shows credit changes for UK large industries since the Brexit referendum in 2016.
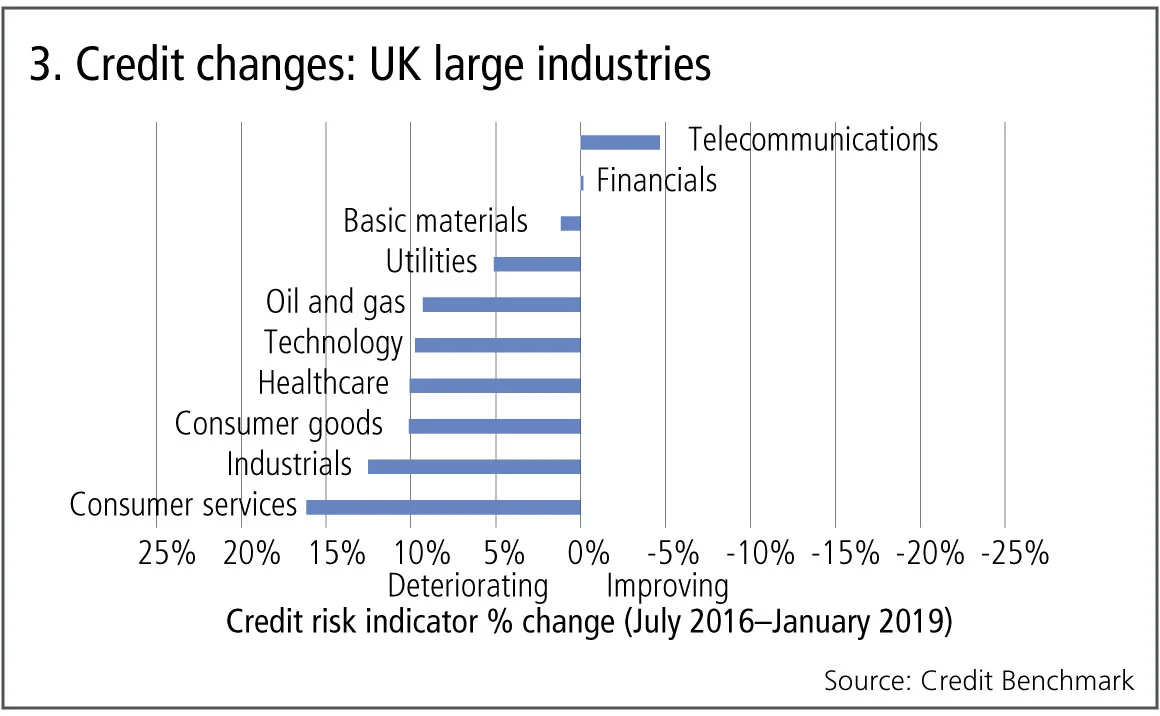
Figure 3 shows:
- The only industry to show a significant improvement over the period is telecommunications, with a 5% credit risk improvement.
- The largest downgrades have been in consumer services and industrials, with deterioration of 16% and 13% respectively. This likely reflects concerns about imported inflation and trade disruption.
- The oil and gas decline is consistent with the credit patterns for the global oil industry.
- Financials show no significant change. This might seem surprising, but suggests banks see scope for limiting any Brexit damage. The recent derivatives clearing deal with the US goes some way to cushioning the impact on Brexit on UK banks.
Tax revenues v sovereign credit risk
The relationship between fiscal strength and sovereign risk might seem obvious, but detailed comparisons with tax revenues show clear anomalies. Some countries are habitual borrowers in order to finance excess government spending; but tax revenues are a key measure of a country’s appetite for its public sector. Are heavily taxed countries typically poorer credit risks?
Figure 4 compares current tax revenues (as a % of GDP) with the logarithm of credit default risk.
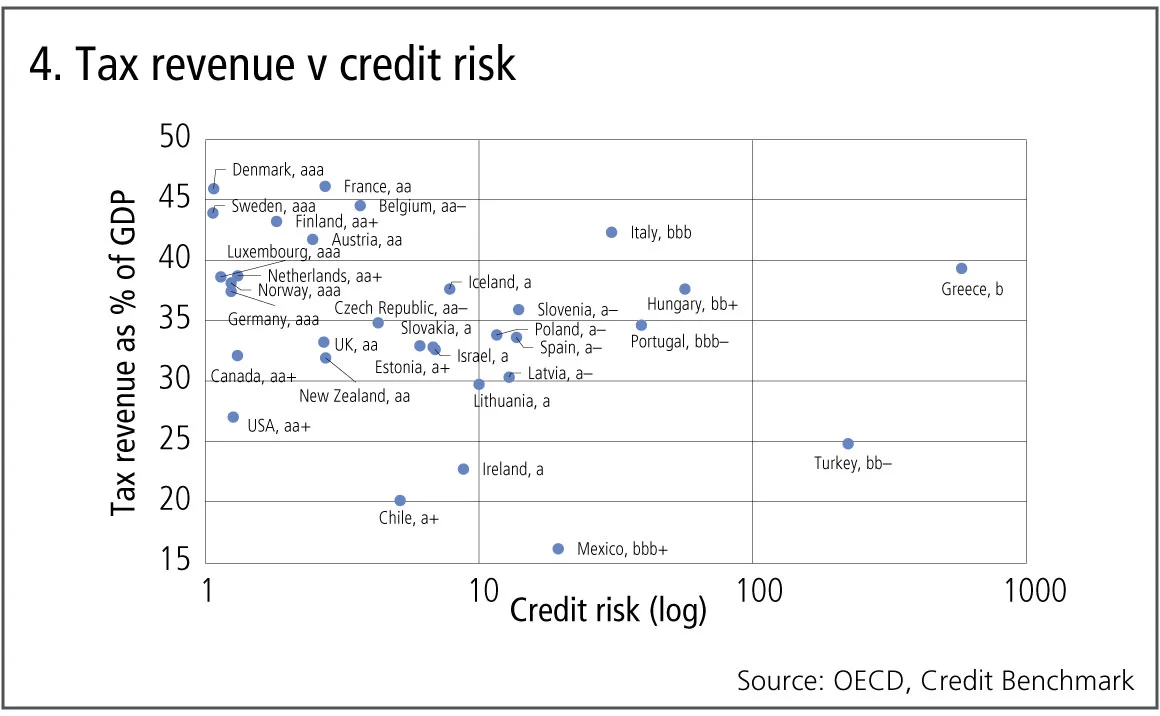
Figure 4 shows some complexities in this relationship:
- Countries with the highest credit ratings tend to be the most heavily taxed. Either sovereign credit risk assessments reward countries that impose – and can enforce – high tax rates; or the wealthiest countries can simply afford a higher tax burden.
- Of the aaa countries, the US is anomalous – it has a much lower tax bill than Germany, the Netherlands or Norway. This reflects two opposing forces: the traditional antipathy among many US voters towards a large government; and the tolerance for US government borrowing in Congress and the financial markets.
- Within the various credit bands, there appears to be a positive relationship between the actual credit risk estimate (measured by logarithm of credit default risk) and the tax burden. Countries in the same credit group are penalised if they tax more heavily.
- Italy, rated bbb, has a similar tax position to the stronger sovereigns such as Austria, Finland and France – suggesting a risk premium advantage of EU and/or euro membership.
- Greece – recovering from an unprecedented debt crisis and currently rated by banks as b – has the same tax proportion as the bulk of the aaa countries. Any more taxation would probably be damaging for the economy; any less could put it on course for another crisis.
US corporate bonds and borrowers
The large proportion of US corporate debt in BBB bonds has raised concerns that any economic weakness could see a significant proportion of these downgraded to non-investment grade. But bonds are only part of the corporate debt picture. Bank-sourced data provides insight into the credit distribution of corporate borrowers that use bank financing, even if they are unrated by the main agencies and/or do not issue bonds. And Standard & Poor’s issuer data shows major differences in comparison with the bond distribution.
Figure 5 compares the US corporate credit distributions for bank borrowers, rated issuers and bond issues.
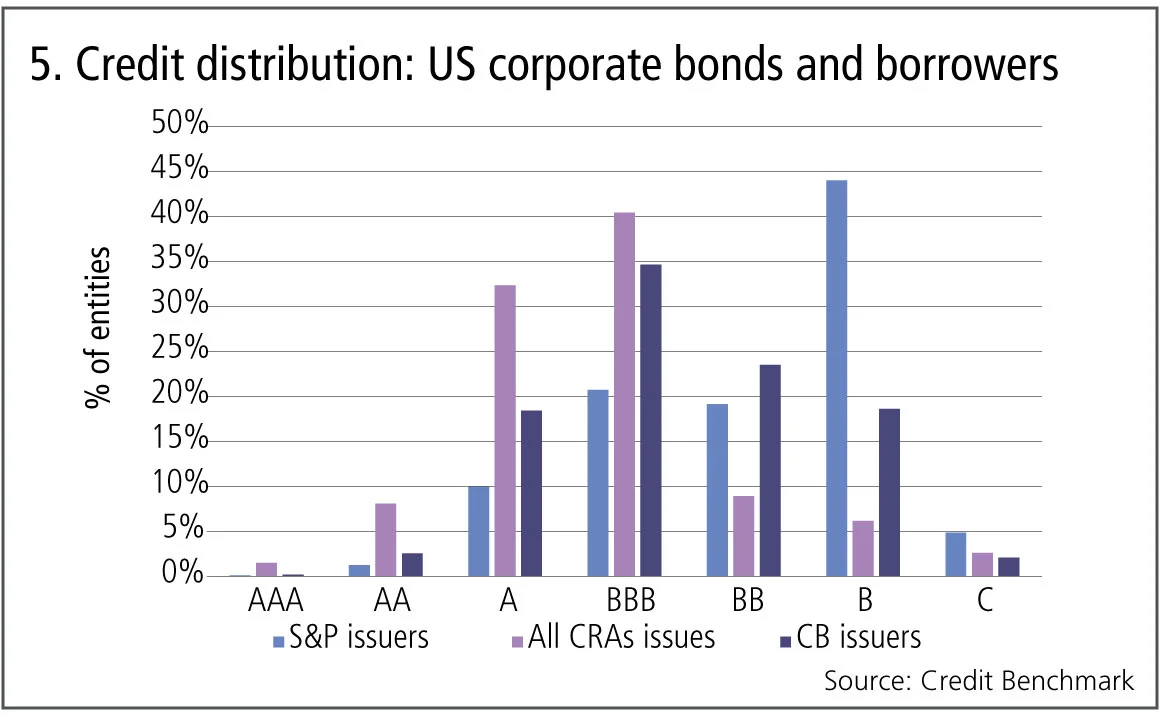
Figure 5 shows:
- There are a high proportions of bonds in the A and BBB categories, and a relatively low proportion in the BB category.
- Relative to bonds, borrowers from banks show a much higher proportion in bb (equivalent to BB) and a significant number in the b category.
- S&P issuers have a very high proportion in the B category. This group seems to be under-represented in the US corporate bond and bank borrower distributions.
- This suggests that many of the B-rated issuers are self-funding, or use peer-to-peer borrowing, and have more limited access to bond issuance or bank borrowing. This group may be most at risk in any credit downturn.
About this data
The Credit Benchmark dataset is based on internally modelled credit ratings from a pool of contributor banks. These are mapped into a standardised 21-bucket ratings scale, so downgrades and upgrades can be tracked on a monthly basis. Obligors are only included where ratings have been contributed by at least three different banks, yielding a total dataset of more than 25,500 names.
David Carruthers is head of research at Credit Benchmark.
Only users who have a paid subscription or are part of a corporate subscription are able to print or copy content.
To access these options, along with all other subscription benefits, please contact info@risk.net or view our subscription options here: http://subscriptions.risk.net/subscribe
You are currently unable to print this content. Please contact info@risk.net to find out more.
You are currently unable to copy this content. Please contact info@risk.net to find out more.
Copyright Infopro Digital Limited. All rights reserved.
You may share this content using our article tools. Printing this content is for the sole use of the Authorised User (named subscriber), as outlined in our terms and conditions - https://www.infopro-insight.com/terms-conditions/insight-subscriptions/
If you would like to purchase additional rights please email info@risk.net
Copyright Infopro Digital Limited. All rights reserved.
You may share this content using our article tools. Copying this content is for the sole use of the Authorised User (named subscriber), as outlined in our terms and conditions - https://www.infopro-insight.com/terms-conditions/insight-subscriptions/
If you would like to purchase additional rights please email info@risk.net
More on Comment
Op risk data: Tech glitch gives customers unlimited funds
Also: Payback for slow Paycheck Protection payouts; SEC hits out at AI washing. Data by ORX News

Op risk data: Lloyds lurches over £450m motor finance speed bump
Also: JPM trips up on trade surveillance; Reg Best Interest starts to bite. Data by ORX News

Georgios Skoufis on RFRs, convexity adjustments and Sabr
Bloomberg quant discusses his new approach for calculating convexity adjustments for RFR swaps

In a world of uncleared margin rules, Isda Simm adapts and evolves
A look back at progress and challenges one year on from UMR and Phase 6 implementation

Op risk data: Morgan Stanley clocked in block trading shock
Also: HSBC deposit guarantee gaffe; Caixa hack cracked; reg fine insult to cyber crime injury. Data by ORX News

Digging deeper into deep hedging
Dynamic techniques and gen-AI simulated data can push the limits of deep hedging even further, as derivatives guru John Hull and colleagues explain

How AI can give banks an edge in bond trading
Machine learning expert Terry Benzschawel explains that bots are available to help dealers manage inventory and model markets

Op risk data: US piqued by Pictet tax breach
Also: US Bank’s Covid failings; South Korea’s short-selling clampdown. Data by ORX News