Credit data: zeroing in on supply chain risk
Data highlights the risks posed by economic protectionism, writes David Carruthers of Credit Benchmark

“An eye for an eye will make the whole world blind,” Gandhi is said to have observed. Sadly, behavioural economists would probably agree he was not far wrong: recent tit-for-tat episodes of tariff imposition by the US, the EU and China demonstrate just how hardwired retaliatory behaviour is. For banks managing their credit exposure to large global manufacturers, whose lengthy supply chains cross many of the impacted countries, the spat poses a more immediate problem: the rise in costs and attendant uncertainties imposed by tariffs has already sparked a material rise in the firms’ probabilities of default.
Trade and tariff disputes have focused attention on the length and fragility of supply chains. Supply chain risk is often seen as an operational problem, but typically supply chain disruption becomes a financial and credit problem.
This month, we look at supply chain risk for 17 large global original equipment manufacturers (OEMs), and their network of some 500 suppliers across the globe. Already, a clear deterioration in the number of investment grade firms they deal with is observable.
Elsewhere this month, we review credit trends for UK corporates, which we’ve been tracking since the Brexit referendum in June 2016. We also highlight regional credit rating differences raised in Basel 2017, and report on the distribution of senior unsecured loss given default estimates.
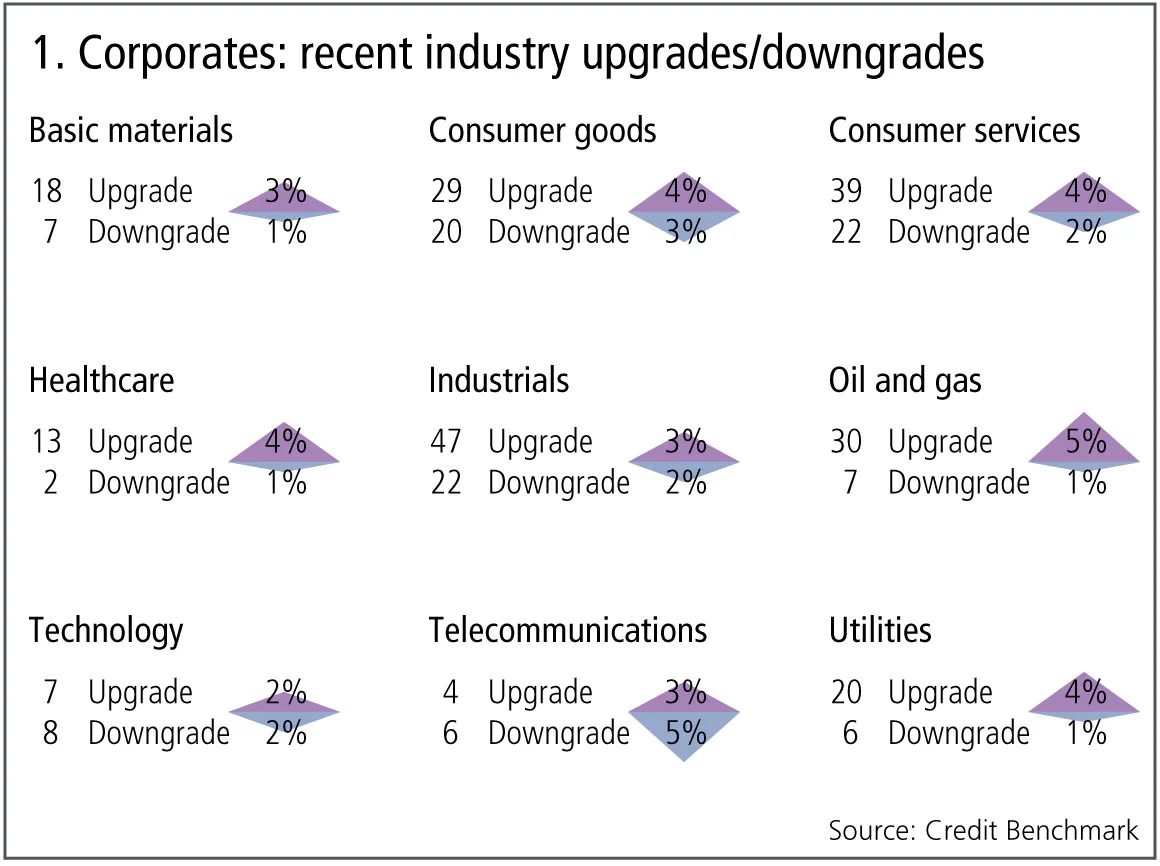
Figure 1 shows:
- Across global corporates, upgrades outnumber downgrades by two to one.
- Upgrades dominate downgrades in seven out of nine industries.
- Basic materials, consumer goods and oil and gas continue their trend of the past few months, with upgrades outweighing downgrades. This is especially marked in oil and gas.
- Technology has stabilised, with upgrades and downgrades balanced after three months that favoured upgrades.
- Telecommunications continues its recent pattern of downgrades slightly outweighing upgrades.
- Consumer services and industrials have moved to upgrades dominating downgrades; both industries were in balance last month and both were in a sustained downtrend in the months prior to that; this may suggest the beginning of a new positive trend.
- Healthcare and utilities have returned to upgrades outweighing downgrades.
Supply chain credit risk
Trade and tariff disputes have focused attention on the length and fragility of supply chains. Supply chain risk is often seen as an operational problem, but typically supply chain disruption becomes a financial and credit problem.
Figure 2 shows the credit and geographic distribution for a sample of more than 500 suppliers to 17 large, global – mainly US – corporate original equipment manufacturers (OEM).
Figure 2 shows:
- The majority (61%) of the suppliers are investment grade; those that are not are mainly in the bb categories. However, a small number are in the b or c categories. The presence of high-risk companies in the supply chain is probably unavoidable, because they may be the sole suppliers of key components or raw materials. But, from a credit perspective, they represent the weakest links in the relevant OEM supply chain.
- Geographically, these suppliers are mainly located in the US, China, South Korea and the UK.
- US companies dominate because most of the companies in the OEM sample are US based, but the importance of the UK is surprising, given that only one company in the OEM sample is UK based. Given the current Brexit debate, this shows the significance of UK companies in the global supply chain.
- A deterioration in credit quality versus a year ago.
UK industry credit trends
With Brexit officially about six months away, the debate about the economic impact has become increasingly polarised. Newspapers like dramatic headlines about shortages of food and medicines, but there is genuine concern about a more volatile economic environment. Bank-sourced credit data confirms the impact of a general increase in business uncertainty, but recent estimates show signs of stability and even a possible improvement.
Figure 3 shows credit trends since June 2016 for large UK industrials (left-hand chart) and large UK healthcare companies (right-hand chart).
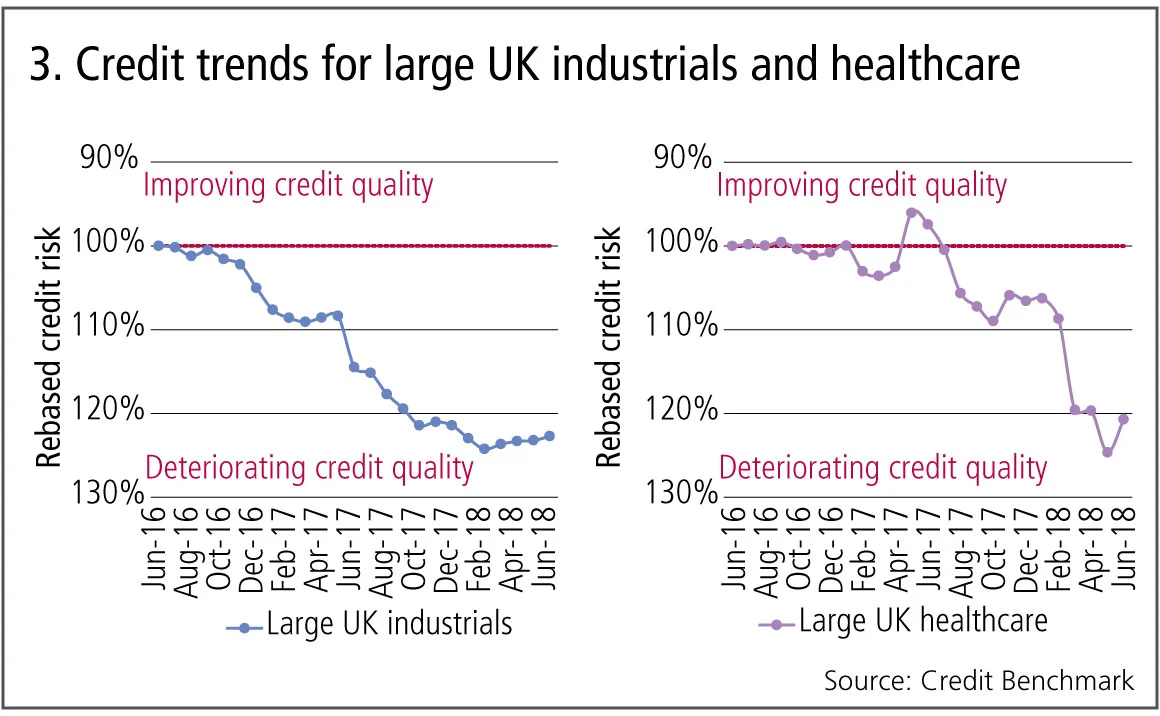
Figure 3 shows:
- Large UK industrials show a deterioration in credit quality since the 2016 referendum.
- At the trough, credit risk for the industrials had increased by about 25%. Since April 2018 it has shown a slight rebound.
- Large UK healthcare companies have been more volatile. Until late 2017, there was no obvious trend; since then there has been a marked deterioration.
- Since the 2016 referendum, the cumulative increase in credit risk for large UK healthcare companies is also 25%, on a par with industrials. Since May 2018, this has also shown a slight improvement.
- Banks anticipated the UK sovereign downgrade by some months in 2016. The recent stabilisation in the two key industries shown here may indicate that the impact of Brexit uncertainty on corporates is now also reflected in bank risk assessments.
Basel 2017 and investment-grade definitions in the US
The December 2017 Basel III reforms have sparked debates about the impact of regional differences in detailed implementation. A key issue is the inability of US banks to use traditional credit ratings for risk-weighted asset allocations. The rules require US banks to recognise borrowers as “investment grade” only if the bank can show that they meet traditional rating agency criteria for that definition and, in addition, have securities (equities or bonds) in issue on a recognised exchange.
Figure 4 shows the bank-sourced credit distribution for a large sample of US corporate borrowers split between those that do (1,394) and do not (1,087) satisfy the “securities in issue” rule.
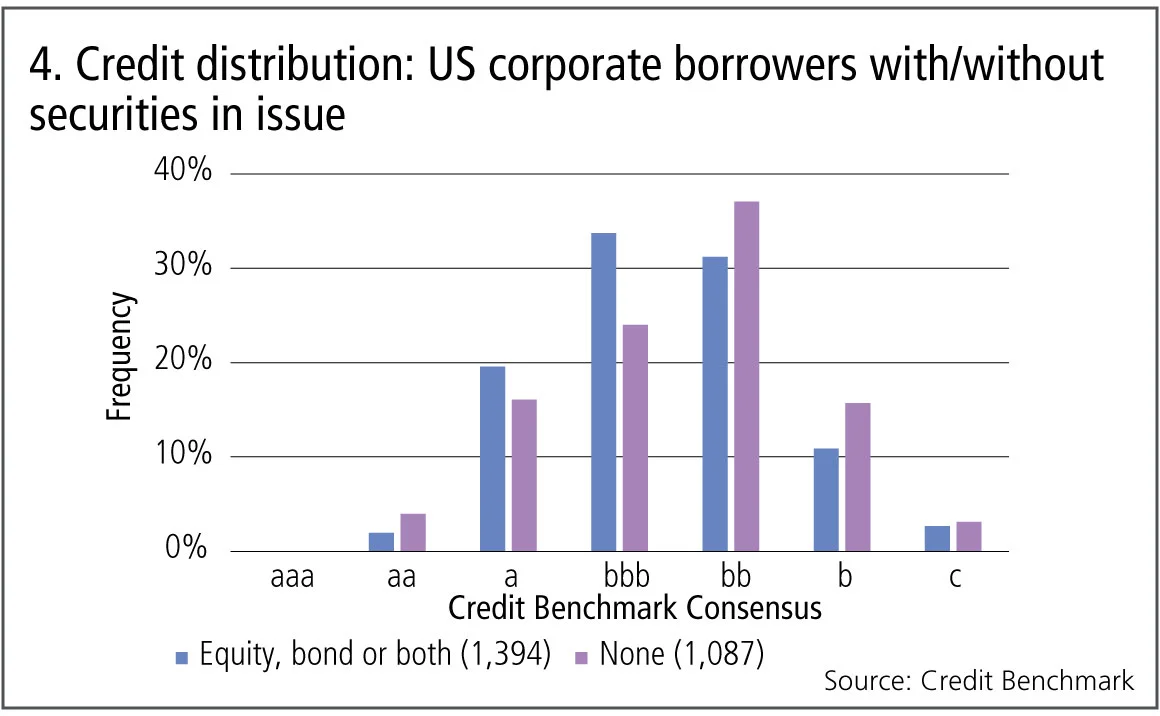
Figure 4 shows:
- US companies with securities in issue have significantly higher credit quality. The majority are in the bbb category and nearly 25% are in a or aa categories.
- However, more than 40% are non-investment-grade categories of bb, b or c.
- US companies without securities in issue have lower credit quality, with more than 40% in the bb category.
- However, bank-sourced estimates suggest that nearly 30% of the companies that do not have securities in issue are nevertheless viewed as investment grade.
Loss given default and recovery rates
Basel III standardises the loss given default (LGD) parameters for regulatory capital, but LGD remains a key driver of inter-bank variations in economic capital. For secured loans, the recovery rate implied by an LGD estimate depends heavily on the value and liquidity of the collateral taken as security. But banks also estimate LGDs for unsecured loans, and this provides a useful starting point for secured calculations.
Figure 5 shows the distribution of bank-sourced estimate for senior, unsecured LGD across 675 corporates.
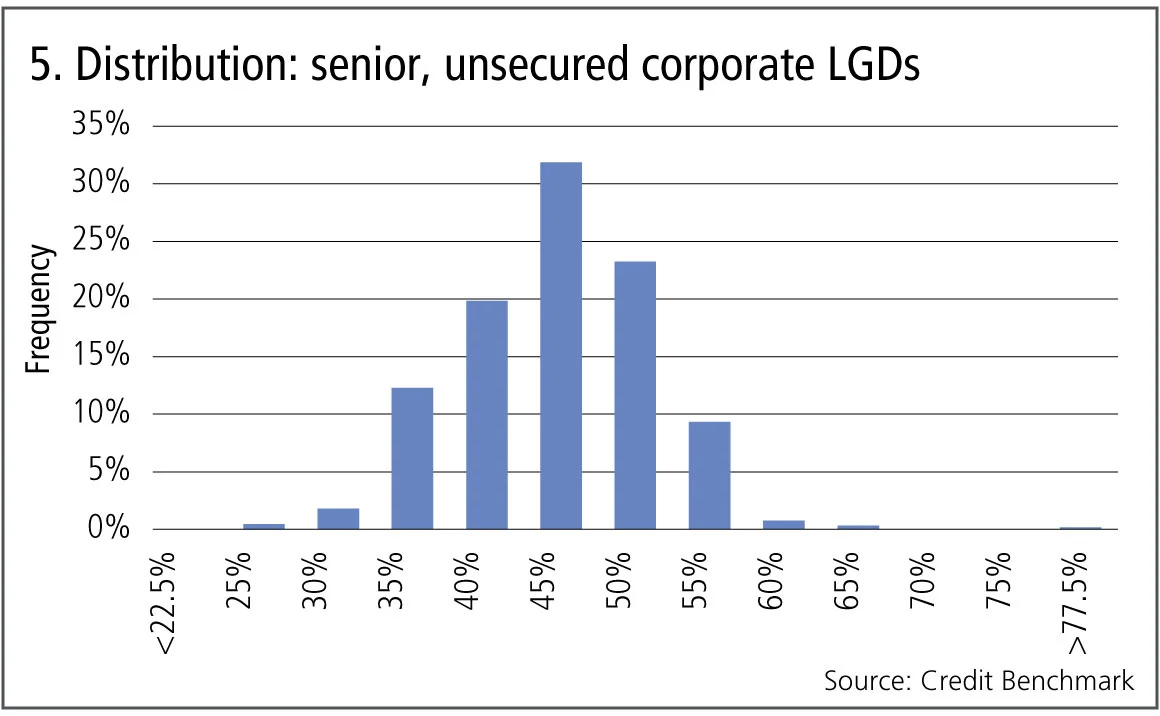
Figure 5 shows:
- The distribution of LGDs is broadly symmetric and approximately normal.
- The average and median are about 45%, which implies a 55% recovery rate assumption.
- Only 32% of the obligors are in the 45% +/–2.5% category, so the majority of LGDs are outside this range, although most are in the range of 35% to 55%.
- This distribution implies that a probability of default of 1% would result in a normal range (i.e. one standard deviation) for expected loss estimates of anything from 0.35% to 0.55% depending on the senior unsecured LGD assumption. For some banks, this could represent a significant difference in required capital.
- LGDs will be lower for secured loans, depending on the collateral held; this initial research applies to unsecured loans.
David Carruthers is the head of research at Credit Benchmark, a credit risk data provider.
About this data
The Credit Benchmark dataset is based on internally modelled credit ratings from a pool of contributor banks. These are mapped into a standardised 21-bucket ratings scale, so downgrades and upgrades can be tracked on a monthly basis. Obligors are only included where ratings have been contributed by at least three different banks, yielding a total dataset of almost 21,000 names, which is growing by 5% per month.
Editing by Tom Osborn
Only users who have a paid subscription or are part of a corporate subscription are able to print or copy content.
To access these options, along with all other subscription benefits, please contact info@risk.net or view our subscription options here: http://subscriptions.risk.net/subscribe
You are currently unable to print this content. Please contact info@risk.net to find out more.
You are currently unable to copy this content. Please contact info@risk.net to find out more.
Copyright Infopro Digital Limited. All rights reserved.
You may share this content using our article tools. Printing this content is for the sole use of the Authorised User (named subscriber), as outlined in our terms and conditions - https://www.infopro-insight.com/terms-conditions/insight-subscriptions/
If you would like to purchase additional rights please email info@risk.net
Copyright Infopro Digital Limited. All rights reserved.
You may share this content using our article tools. Copying this content is for the sole use of the Authorised User (named subscriber), as outlined in our terms and conditions - https://www.infopro-insight.com/terms-conditions/insight-subscriptions/
If you would like to purchase additional rights please email info@risk.net
More on Comment
Op risk data: Tech glitch gives customers unlimited funds
Also: Payback for slow Paycheck Protection payouts; SEC hits out at AI washing. Data by ORX News

Op risk data: Lloyds lurches over £450m motor finance speed bump
Also: JPM trips up on trade surveillance; Reg Best Interest starts to bite. Data by ORX News

Georgios Skoufis on RFRs, convexity adjustments and Sabr
Bloomberg quant discusses his new approach for calculating convexity adjustments for RFR swaps

In a world of uncleared margin rules, Isda Simm adapts and evolves
A look back at progress and challenges one year on from UMR and Phase 6 implementation

Op risk data: Morgan Stanley clocked in block trading shock
Also: HSBC deposit guarantee gaffe; Caixa hack cracked; reg fine insult to cyber crime injury. Data by ORX News

Digging deeper into deep hedging
Dynamic techniques and gen-AI simulated data can push the limits of deep hedging even further, as derivatives guru John Hull and colleagues explain

How AI can give banks an edge in bond trading
Machine learning expert Terry Benzschawel explains that bots are available to help dealers manage inventory and model markets

Op risk data: US piqued by Pictet tax breach
Also: US Bank’s Covid failings; South Korea’s short-selling clampdown. Data by ORX News