
This article was paid for by a contributing third party.More Information.
Volatility in the crosshairs: Aligning volatility and strategies part 1

By Dave Lerman, CME Group
It’s often been said that while futures are “two-dimensional” instruments, options tend to be four-dimensional instruments. With futures you are generally concerned with up and down direction only. With options however, you must deal with the ups and downs of the underlying as well as time decay and changes in implied volatility. Too often, beginners, and even more experienced traders ignore where we are at on the volatility continuum and it can lead to sub optimal trading results.
In this paper we will discuss volatility from a slightly different perspective. We will attempt to distinguish average levels of volatility from above average volatility and measure the extremes of volatility on both the high side and low side. The goal: To formulate more profitable strategies by considering the current volatility environment. What do we mean by that? Many options traders are familiar with a straddle where you buy a call and a put with the same expiry and same strike price. Ideally, you want to execute long straddle positions in low volatility environments with the expectation that vol (vol = volatility) will rise significantly in the near future. The problem is many traders make the mistake of doing such a strategy in higher volatility environments. Doing so carries more risk and a reduced chance of profiting from the trade.
Hence, for some time now, we at CME Group have been going beyond looking at a typical volatility chart to determine the state of volatility and producing implied volatility percentile rankings. Volatility percentile rankings allow the trader to “grade” current volatilities in terms of what’s high, what’s exceedingly high vs. what is low vs. what is historically low as well as average levels of volatility.
Looking at Figure 1 below; illustrates the typical chart from looking at implied volatility over some period. You get some sense of highs and lows…observing that volatility rarely gets above 20-25 percent and rarely goes below 7-8 percent. Ideally, you want to buy low and sell high with volatility as well. Higher vol helps a long options position and lower vol hurts a long options position (all other things being equal).
Figure 1
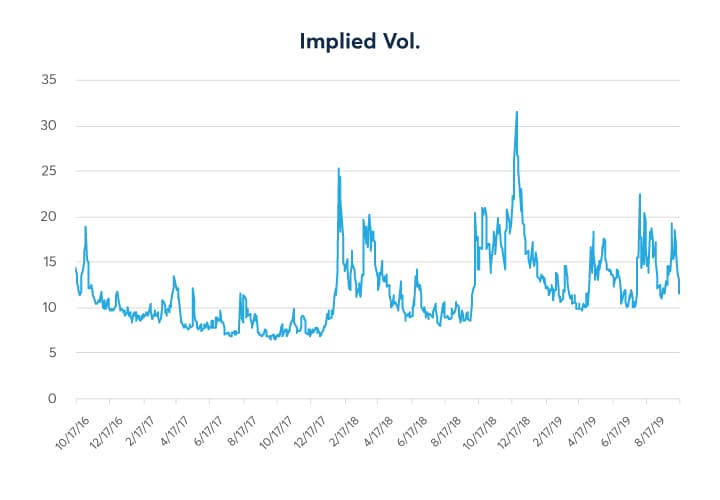
Source: QuikStrike
While the chart in figure 1 gives a quick snapshot of 3-years of implied Volatility, there is a way to observe volatility on a more granular level. This can be done with implied volatility percentile rankings shown in figure 2. Percentile rankings utilized the same data as in figure 1 but were just reformulated to allow a deeper dive into a “volatility gradient”. Bear with me here as we draw an analogy. Implied volatility percentile rankings work much like college entrance exams that many of us are familiar with. If you took, for example, the SAT test, you received two scores: a raw score and a percentile ranking. If you scored a 790 on the math section, you were in the 99th percentile. That is, you beat 99 percent of those that took the test and likely went on to a prestigious university. If you scored a 300, you were in the 10th percentile and would probably want to retake the exam as 90% of those taking the exam scored higher.
Volatility percentile rankings work the same way. We took the implied volatility numbers each day and ranked them using a percentile generator in excel. Figure 2 shows the implied volatility percentile rankings for the E-mini S&P 500 options on futures. The data was taken each day and we used three years of data (ending October 16 in this case). The implied vol is the ATM straddle using a 30-day expiry (constant maturity).
Figure 2

The highest implied volatility during this 3-year window was 31.64.
The 90th percentile level was an implied vol of 17.29%
The 75th percentile level was an implied vol of 13.79%
The 50th percentile level was an implied vol of 10.56%
The 25th percentile level was an implied vol of 8.81%
The 10th percentile level was an implied vol of 7.59
The lowest implied vol during that three-year window was 6.50 which, in fact, is very close to the at-time historic low of 6.40 % attained since the launch of the E-mini contract. So, let’s say todays implied volatility was calculated to be 7.59%. This would put it at the 10th percentile—i.e. 90 percent of the time implied volatility was higher. Rising volatility helps long options positions. Traders get long premium (straddles, strangles, etc.…) in anticipation of higher vol in the near term (the last column of figure two shows the ATM straddle in premium and dollar terms).
At the 10th percentile the ATM straddle would cost the buyer 50.51 pts (or $2,525). But the price of the same straddle at the 50th percentile is a much higher 70.14 pts (or $3,500)—a substantial difference. By comparing the current volatility rank to the relative level of volatility over time, the trader can discern the probability of higher/lower volatility—which could lead to better odds of trading success. In subsequent installments of this series, we shall probe further and look at implied volatility percentile rankings in many of CME Group’s major product lines including equities, rates, currencies and commodities.
For those inclined to sell options premium, the goal would be to do so in higher vol environments such as the 75-90th percentile. But remember, selling options carries unlimited risk. Hence, your risk management capabilities must be spot on and your account large enough to withstand the added risk.
Most importantly, percentile rankings can help you manage risk. If you are going to be wrong with an options purchase, better to be wrong buying premium in the 10th percentile than in the 90th percentile. Just notice the difference in the premiums of the ATM straddle in figure two at the 10th percentile and the 90th percentile. The straddle at the 90th percentile is twice more than as expensive. Being wrong in the 10th percentile would cost you only half as much should you experience the maximum loss.
Sponsored content
Copyright Infopro Digital Limited. All rights reserved.
You may share this content using our article tools. Printing this content is for the sole use of the Authorised User (named subscriber), as outlined in our terms and conditions - https://www.infopro-insight.com/terms-conditions/insight-subscriptions/
If you would like to purchase additional rights please email info@risk.net
Copyright Infopro Digital Limited. All rights reserved.
You may share this content using our article tools. Copying this content is for the sole use of the Authorised User (named subscriber), as outlined in our terms and conditions - https://www.infopro-insight.com/terms-conditions/insight-subscriptions/
If you would like to purchase additional rights please email info@risk.net