
Monthly credit data review: the Amazon effect and a rising Russian state
David Carruthers of Credit Benchmark looks at bank, sovereign and corporate credit risk data
As the world’s largest petro-state, at least by land area, Russia’s prosperity depends heavily on the behaviour of the energy markets. The sustained low prices of the 1990s brought a crippling depression; the oil boom of the 2000s led to a newly confident and aggressive Russia. The second piece of the picture is the sanctions imposed on Russian businesses, banks and individuals after the invasion of Ukraine in 2014. Though they remain in place and are set to be strengthened after the US Congress voted on renewed sanctions this month, the Russian financial sector has staged a modest recovery, with credit ratings for major Russian banks - mostly state-owned - and the Russian government itself rising gently, though still remaining below investment grade.
Energy may be part of the reason why. Though oil benchmark prices have not moved substantially over the last month, there has been a general increase in credit quality in the energy sector around the world, with upgrades outnumbering two to one - significantly better than the picture in other sectors, where the downward trend of the previous month continued.
This month we take a more detailed look at the Russian government and Russian banks, as well as retailers, asset management firms, and investment-grade gains and losses in the past 12 months.
Global credit industry trends
Figure 1 shows industry migration trends for the most recent published data, as well as the history for the past 12 months.
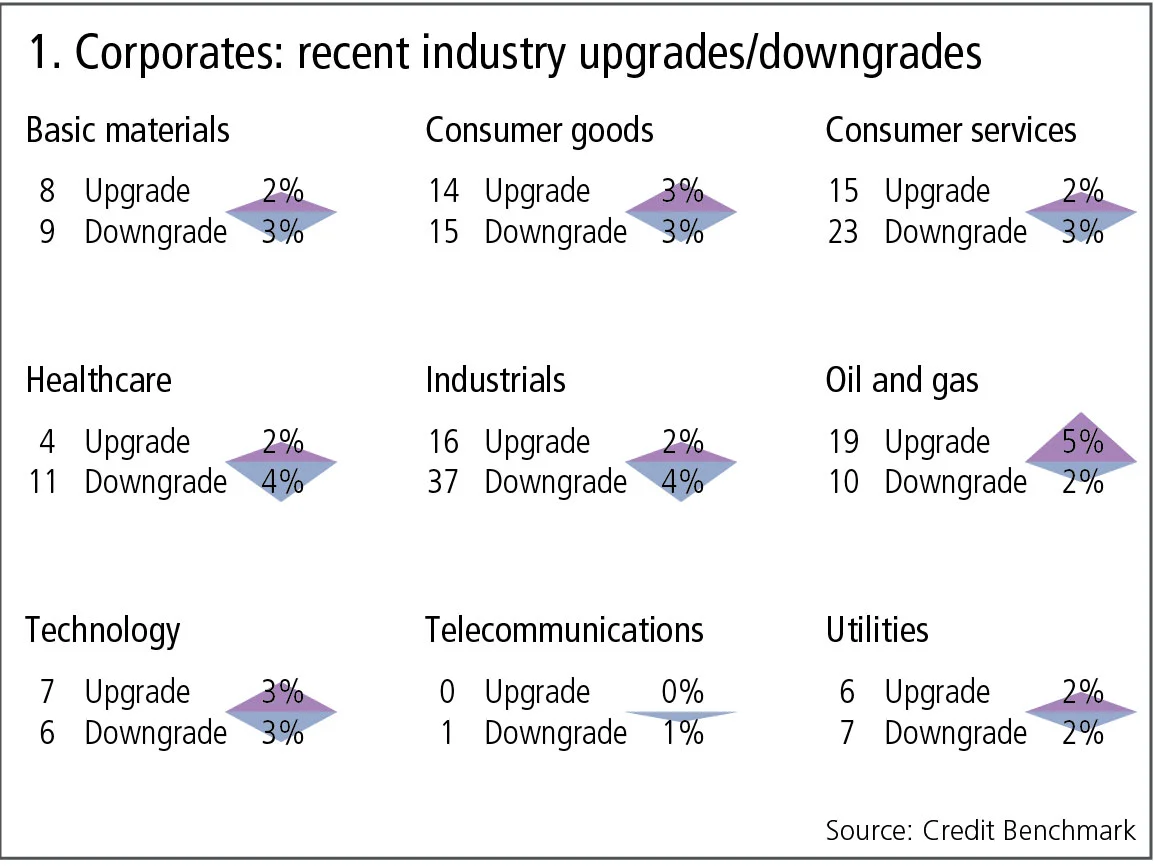
Figure 1 shows:
- Global corporate downgrades still outnumber upgrades by 1.3 to 1, but this is more balanced than last month when the ratio was 1.4 to 1.
- Industrials continue the pattern of last month, showing 37 downgrades against 16 upgrades. Last month, the equivalent figures were 39 downgrades against 35 upgrades, so the imbalance has increased.
- Consumer services and health care also show significant imbalances, with downgrades exceeding upgrades by a significant margin.
- Consumer goods have moved to a more balanced position following recent downgrades, and oil and gas upgrades outnumber downgrades by almost two to one.
Russia: sovereign risk and banks, comparison with global banks
The Russian economy has been severely hit by sanctions and weak oil prices, but recent data shows that the credit outlook is improving. Figure 2 plots the nine-month time series of credit trends for the government of Russia and 12 of the major Russian banks.
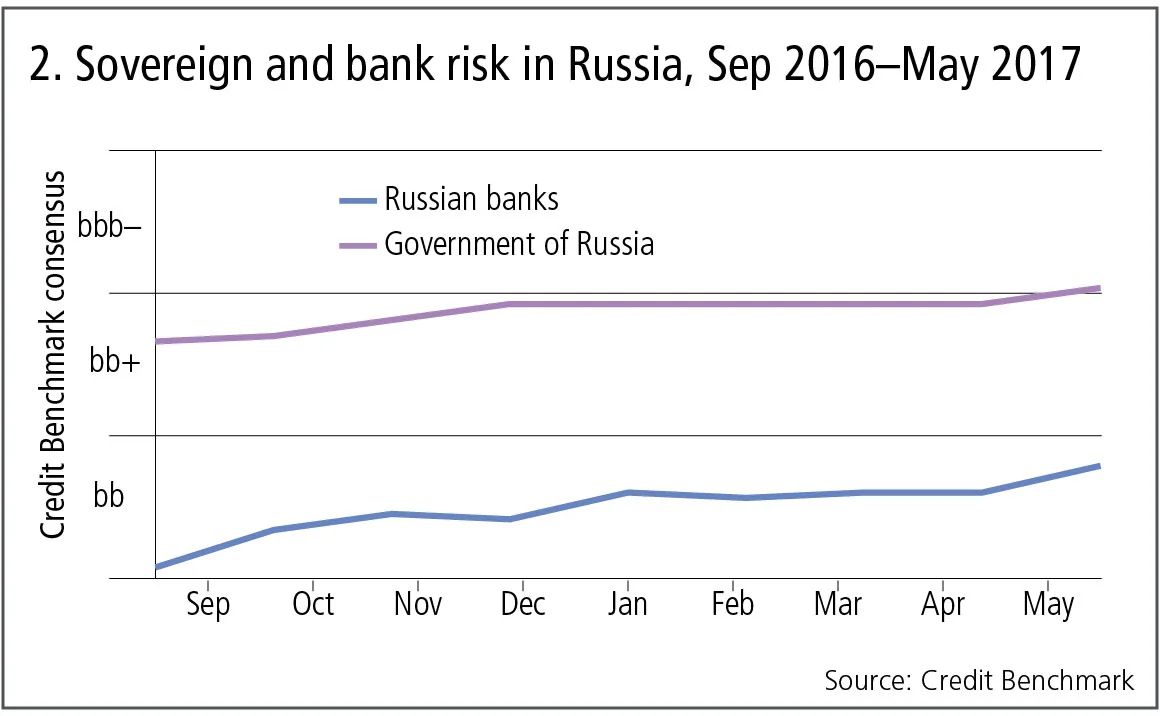
Figure 2 shows:
- The Russian government was viewed as bb+ in September 2016. It improved every month until the end of the year, but stabilised just below the investment-grade threshold. At the end of May, IRB banks moved the Russian government to investment grade (bbb–).
- The trend for the major Russian banks (mainly state-owned) is very similar, but they are still currently viewed as non-investment grade.
Credit trends in retailers
The traditional retail industry is suffering from the ‘Amazon effect’. But Amazon’s acquisitions of traditional retail businesses show that the impact of online competition can play out in a number of different ways. Figure 3 compares the credit trends for 46 US and 56 European apparel and general merchandise retailers as well as for Amazon and Whole Foods Market.
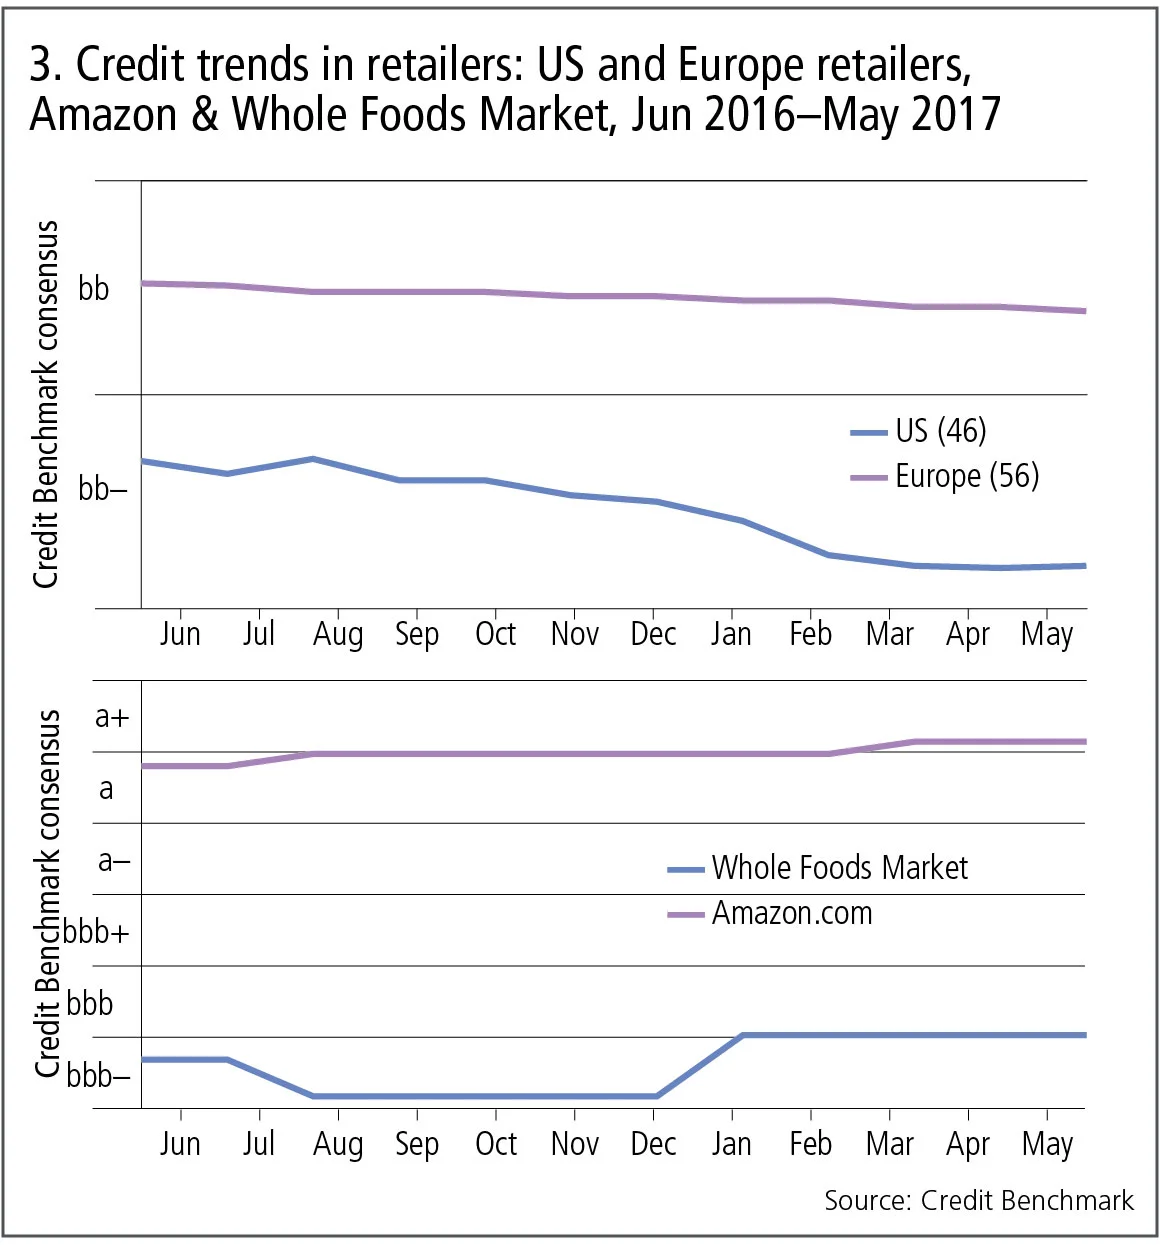
Figure 3 shows:
- Apparel and general retailers in both regions are already viewed as non-investment grade. The down trends have been the dominant pattern over the past 12 months. By comparison, the credit status of specialised retailers and food retailers has been stable or improving.
- The deterioration in the US is particularly noticeable; this may have implications for the future credit standing of European retailers as well.
- The credit consensus for Amazon has been steadily improving, and is significantly better than a typical corporate like Whole Foods Market.
Credit distribution of asset management firms
Asset management firms rarely feature in discussions of credit risk. Figure 4 shows the range for about 350 managers. These are a mix of traditional long-only managers, hedge fund managers and hybrid management firms.
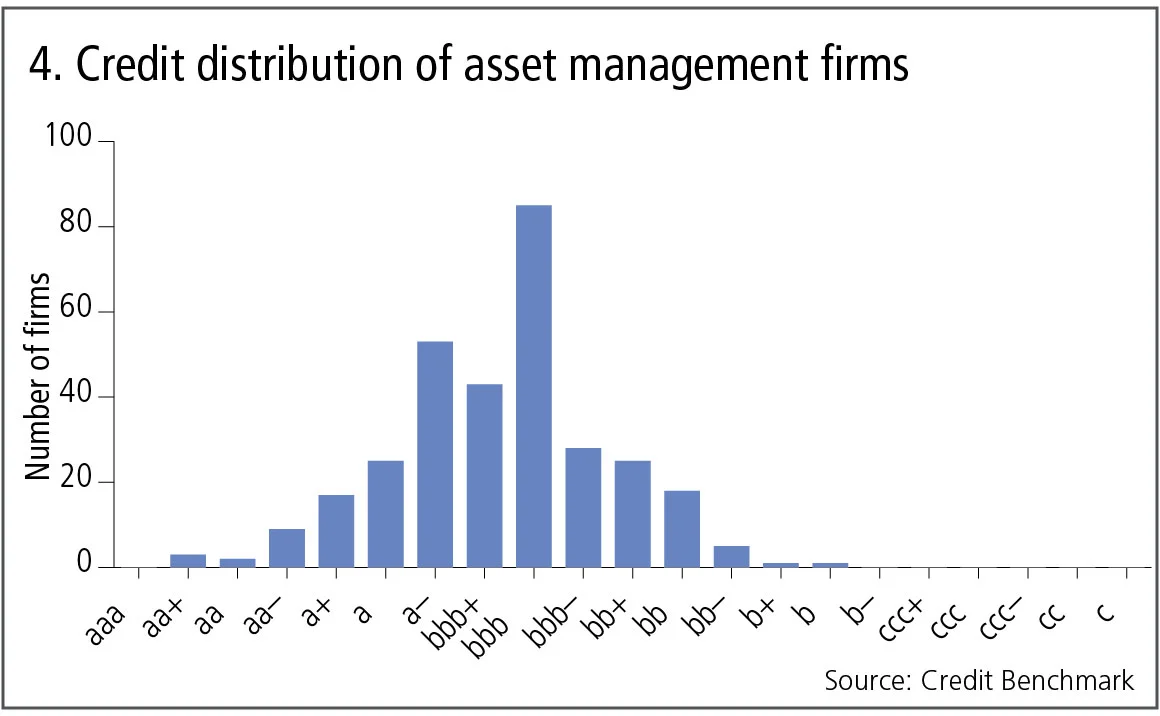
Figure 4 shows:
- Asset management companies show a surprisingly wide range of credit risks, from aa+ to b. The majority are viewed as bbb, with a large number just above this at a– and bbb+.
- This range probably reflects the size, longevity and performance of each firm, as well as the volatility and leverage of the assets that they manage. The distribution shown here indicates that the majority of firms represent a balance between these credit drivers, putting them in the same credit risk categories as a typical corporate.
- Firms in the right tail of the distribution may be excessively exposed to some of these risk sources.
Investment grade: gainers and losers in the past 12 months
The table in Figure 5 shows some of the major borrowers that moved into, or out of, investment grade in the past 12 months. The investment-grade threshold corresponds to an annual probability of default of 0.48%.
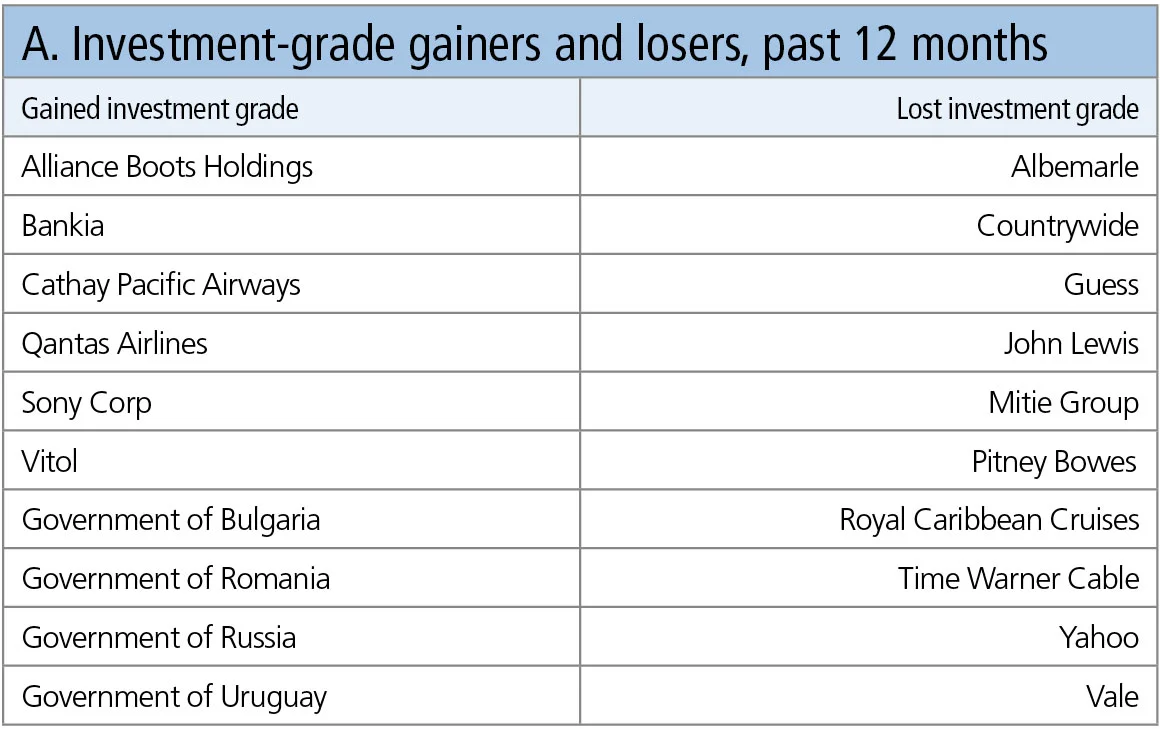
Table A shows:
- Four sovereigns have achieved investment grade, including the recent move in Russia’s status discussed above.
- Cathay Pacific, recently voted one of the top airlines in the world, was moved to investment grade, along with Qantas. Bankia’s move to investment grade reflects recent success across the European banking industry in strengthening balance sheets.
- The Amazon effect can be seen in the downgrades of John Lewis, Guess and Time Warner Cable.
- Some of the other downgrades – Albemarle, Yahoo, Countrywide, Mitie and Royal Caribbean – are more company-specific, but the underlying economic drivers are likely to affect similar companies in the same sectors.
David Carruthers is the head of research at Credit Benchmark, a credit risk data provider.
Only users who have a paid subscription or are part of a corporate subscription are able to print or copy content.
To access these options, along with all other subscription benefits, please contact info@risk.net or view our subscription options here: http://subscriptions.risk.net/subscribe
You are currently unable to print this content. Please contact info@risk.net to find out more.
You are currently unable to copy this content. Please contact info@risk.net to find out more.
Copyright Infopro Digital Limited. All rights reserved.
You may share this content using our article tools. Printing this content is for the sole use of the Authorised User (named subscriber), as outlined in our terms and conditions - https://www.infopro-insight.com/terms-conditions/insight-subscriptions/
If you would like to purchase additional rights please email info@risk.net
Copyright Infopro Digital Limited. All rights reserved.
You may share this content using our article tools. Copying this content is for the sole use of the Authorised User (named subscriber), as outlined in our terms and conditions - https://www.infopro-insight.com/terms-conditions/insight-subscriptions/
If you would like to purchase additional rights please email info@risk.net
More on Comment
Op risk data: Tech glitch gives customers unlimited funds
Also: Payback for slow Paycheck Protection payouts; SEC hits out at AI washing. Data by ORX News
Op risk data: Lloyds lurches over £450m motor finance speed bump
Also: JPM trips up on trade surveillance; Reg Best Interest starts to bite. Data by ORX News
Georgios Skoufis on RFRs, convexity adjustments and Sabr
Bloomberg quant discusses his new approach for calculating convexity adjustments for RFR swaps
In a world of uncleared margin rules, Isda Simm adapts and evolves
A look back at progress and challenges one year on from UMR and Phase 6 implementation
Op risk data: Morgan Stanley clocked in block trading shock
Also: HSBC deposit guarantee gaffe; Caixa hack cracked; reg fine insult to cyber crime injury. Data by ORX News
Digging deeper into deep hedging
Dynamic techniques and gen-AI simulated data can push the limits of deep hedging even further, as derivatives guru John Hull and colleagues explain
How AI can give banks an edge in bond trading
Machine learning expert Terry Benzschawel explains that bots are available to help dealers manage inventory and model markets
Op risk data: US piqued by Pictet tax breach
Also: US Bank’s Covid failings; South Korea’s short-selling clampdown. Data by ORX News


