Journal of Network Theory in Finance
ISSN:
2055-7795 (print)
2055-7809 (online)
Editor-in-chief: Ron Berndsen
Quantifying the diversity of news around stock market moves
Chester Curme, Ying Daisy Zhuo, Helen Susannah Moat and Tobias Preis
Need to know
- The authors use a topic-modeling approach to quantify the changing attentions of a major news outlet, the Financial Times, to issues of interest.
- They find the diversity of financial news can improve forecasts of trading volume.
- Financial news can be a useful forecasting tool.
Abstract
The dynamics of news are such that some days are dominated by a single story while others see news outlets reporting on a range of different events. While these largescale features of news are familiar to many, they are often ignored in settings where they may be important in understanding complex decision-making processes, such as in financial markets. In this paper, we use a topic-modeling approach to quantify the changing attentions of a major news outlet, the Financial Times, to issues of interest. Our analysis reveals that the diversity of financial news, as quantified by our method, can improve forecasts of trading volume. We also find evidence which suggests that, while attention in financial news tends to be concentrated on a smaller number of topics following stock market falls, there is a “healthy diversity” of news following upward market movements. We conclude that the diversity of financial news can be a useful forecasting tool, offering early warning signals of increased activity in financial markets.
Copyright: The Authors 2017. This article is distributed under the terms of the Creative Commons Attribution 4.0 International License
Introduction
The well-being of individuals and entire economies is becoming increasingly tied to activity in the financial sector, a point emphasized by the 2008 financial crisis. A large portion of this activity is reflected in stock market movements, which are driven by the trading decisions of many investors. The motivating forces behind these decisions, whether they are exogenous news items or the endogenous influences of other traders, have therefore received much scientific attention (Haldane and May 2011; Gopikrishnan et al 2000; Preis et al 2012; Gabaix et al 2003; Cont and Bouchaud 2000; Queirós 2005; Bollen et al 2011; Hommes 2002; Lux and Marchesi 1999; Curme et al 2015; Uzzi et al 2007; Pišorec et al 2014; Botta et al 2015; Schweitzer et al 2009; Jackson 2008; Graczyk and Queirós 2016; Feng et al 2012).
Network science has done much to advance our understanding of economic systems (Haldane and May 2011; Uzzi et al 2007; Jackson 2008). Where interactions can be measured and quantified, network representations of these systems have revealed generalities beneath complex behavior (Schweitzer et al 2009; Majdandzic et al 2014, 2016; Tumminello et al 2010). An understanding of systematic relationships between financial news and the actions of traders and investors has, however, largely remained elusive. This is in part because the information embedded in textual documents is difficult to quantify. Nonetheless, one observes certain regularities in the ebbs and flows of stories into and out of the news, at least qualitatively. During the “silly season” or “slow news season” in the summer months, for example, the media may focus increased attention on seemingly frivolous topics. By contrast, attention in the news may be sharply focused on a smaller number of issues during a war, or following natural or economic disasters. The variety of news-story lifetimes is also familiar: whereas some topics remain in the news for great lengths of time, others are forgotten soon after they are first reported. In order to understand the interplay between the actions of investors and issues in financial news, it may first be necessary to grapple with these common “meta-characteristics” of news items.
Such intuitions about the world have traditionally been difficult to subject to scientific scrutiny. Recent technological advances have, however, changed the landscape of data on social processes. The use of technological systems is becoming increasingly ingrained in society, leading to the creation of vast volumes of data on human behavior. Indeed, the field of computational social science (Conte et al 2012; Lazer et al 2009; Moat et al 2014b) has arisen out of this new ability to measure behavior at scale. This new data has enabled researchers to represent complex biological, social and economic systems as networks of interactions, establishing a common framework in which to investigate the general features of these systems. A challenge to uncovering the networks underlying complex systems is the quantification of relevant features that describe the nodes and edges. In particular, advances in natural language processing and text analysis have assisted in the quantification of certain features in financial news as well as the study of how these features individually relate to market activity. Indeed, automated approaches to forecasting financial market movements through the text-mining of news and social media has driven the development of entire industries (Feldman 2013). Academic interest has also focused on the reciprocity of the relationship between news and market movements (Alanyali et al 2013). Recently, much attention has been devoted to the information embedded in novel online sources, such as social media (Bollen et al 2011; Gleeson et al 2014; Oliveira et al 2013) and internet search records (Goel et al 2010; Preis et al 2010; Preis and Moat 2015; Moat et al 2014a; Preis et al 2013; Moat et al 2013; Curme et al 2014; Moat et al 2016).
When one sets out to relate textual information to some real-world activity, one is immediately confronted with a vast universe of words, each of which may or may not be individually relevant to the question at hand. That is, text data is naturally high dimensional. A first step toward rendering this data tractable for analysis, then, is often to reduce its dimensionality by clustering words together into groups. A common tool for this task is topic modeling. Under this approach, a text corpus is partitioned into documents, each of which is usually treated as an unordered collection of words, or a “bag of words”. One can then use the co-occurrence of words in documents in order to infer semantic similarities among words and documents. For example, the words “rain”, “wind” and “clouds” may naturally occur together frequently in documents, allowing one to associate them as members of a single topic, in this case related to the weather.
Topic-modeling algorithms treat each document as a mixture of topics, allowing one to both group words into topics and to measure similarities between the mixtures of topics in two separate documents. One of the simplest and most popular topic-modeling algorithms is latent Dirichlet allocation (LDA; Blei et al (2003)). LDA and similar methods, such as probabilistic latent semantic analysis (PLSA; Hofmann (1999)) represent documents in a low-dimensional “semantic space”, allowing one to abstract away from individual keywords in order to describe the distribution of topics, each of which is a distribution of keywords, in a document. A document discussing a hurricane in a certain country, for example, might be represented as 30% in a topic about weather, 30% in a topic about that particular country or region of the world and 40% in topics about politics or economics, discussing the ramifications of the event (see Blei (2012) for a review of this subject).
LDA has been applied to financial news corpora and internet search data in an effort to understand what groups of keywords may be related to large trading volumes or market returns when searched online (Curme et al 2014), or when appearing in the news (Hisano et al 2013). Most approaches, however, focus on determining the importance of individual topics, such as groups of “bearish” or “bullish” keywords. Just as the collective actions of individual traders are relevant to stock market movements, we hypothesize that larger-scale descriptions of news, such as the tendency of news to focus on large or small numbers of topics, may also bear relevance in understanding trading decisions.
Here, we investigate the relationship between the diversity of topics appearing in financial news – represented by daily issues of the Financial Times – and trading activity in financial markets. Specifically, we apply a topic-modeling approach in order to distill to a single number the extent to which a given issue of the Financial Times is focusing on a large or small number of topics. We consider the time series of this news diversity, as constructed from a corpus of financial news from 2007 to 2012, where drops in diversity correspond to attention being focused on a smaller number of topics in the news. We present evidence that the time series of diversity can be applied to assist forecasts of daily trading volume, and find that increases in trading volume tend to coincide with falls in diversity of the Financial Times that morning. Moreover, we find that drops in diversity follow falls in the stock market, while increases in diversity follow upward market movements. Our analysis suggests that the breadth of news to which traders are exposed may be important in understanding the information flows that are at play during large stock market movements.
2 Results
To understand the diversity of news in an issue of the Financial Times, a natural first step is to measure what topics are represented in the news, as well as the space devoted to each topic. LDA presents an ideal framework for these measurements, as it is a standard tool for decomposing a text into a mixture of topics, each of which is assigned a “weight” that represents the fraction of content that is devoted to that topic.
We trained an LDA model using daily issues of the Financial Times for the period January 2, 2007–December 31, 2012. These issues were converted to text, cleaned of anything other than letters and white space, filtered for common words (eg, “the”, “and”, “of”) from a list of stop words and split into individual paragraphs. We used the resulting text as training data for the LDA. A full description of the text preprocessing is provided in the supplementary material (available online).
In the framework of LDA, a topic is a distribution over a finite number of words. Each topic is then a list of words, each of which is associated with a numeric weight, such that the weights sum to one. The LDA algorithm models each document in a corpus as a mixture of topics. We choose to treat each paragraph of the Financial Times as a separate document, in order to obtain 937 649 total documents of roughly equal length. Each issue on average contains approximately 515 documents.
We configure an LDA to model each document as a mixture of topics. Upon post hoc inspection, the selection of results in a reasonable identification of topics. Moreover, we can check how well our model fits the text, and find that changes from this value of do not considerably augment the model’s likelihood, as measured by low model perplexities when testing on held-out corpora. We uncover a range of topics, involving politics (“labor”, “elect”, “party”, etc), energy and the environment (“carbon”, “energy”, “environment”, etc), technology (“google”, “facebook”, “social”, etc) and the economy (“market”, “rate”, “bank”, etc). The full list of topics recovered from the LDA is provided in Table S1 in the supplementary material.
Once the LDA is trained, each document in the corpus is represented by the -dimensional topic vector . The terms in this vector may be interpreted as probabilities and, therefore, sum to one. In order to quantify the distribution of topics in the financial news on a given day, we compute a normalized sum of the distribution of topics over each document (paragraph) in the corresponding issue of the Financial Times, as described in the supplementary material. This yields a -dimensional vector , which also sums to one, and quantifies the distribution of topics represented in the Financial Times on day . The collection of all forms the rows of a matrix . We display the first 100 rows of in Figure 1(a).
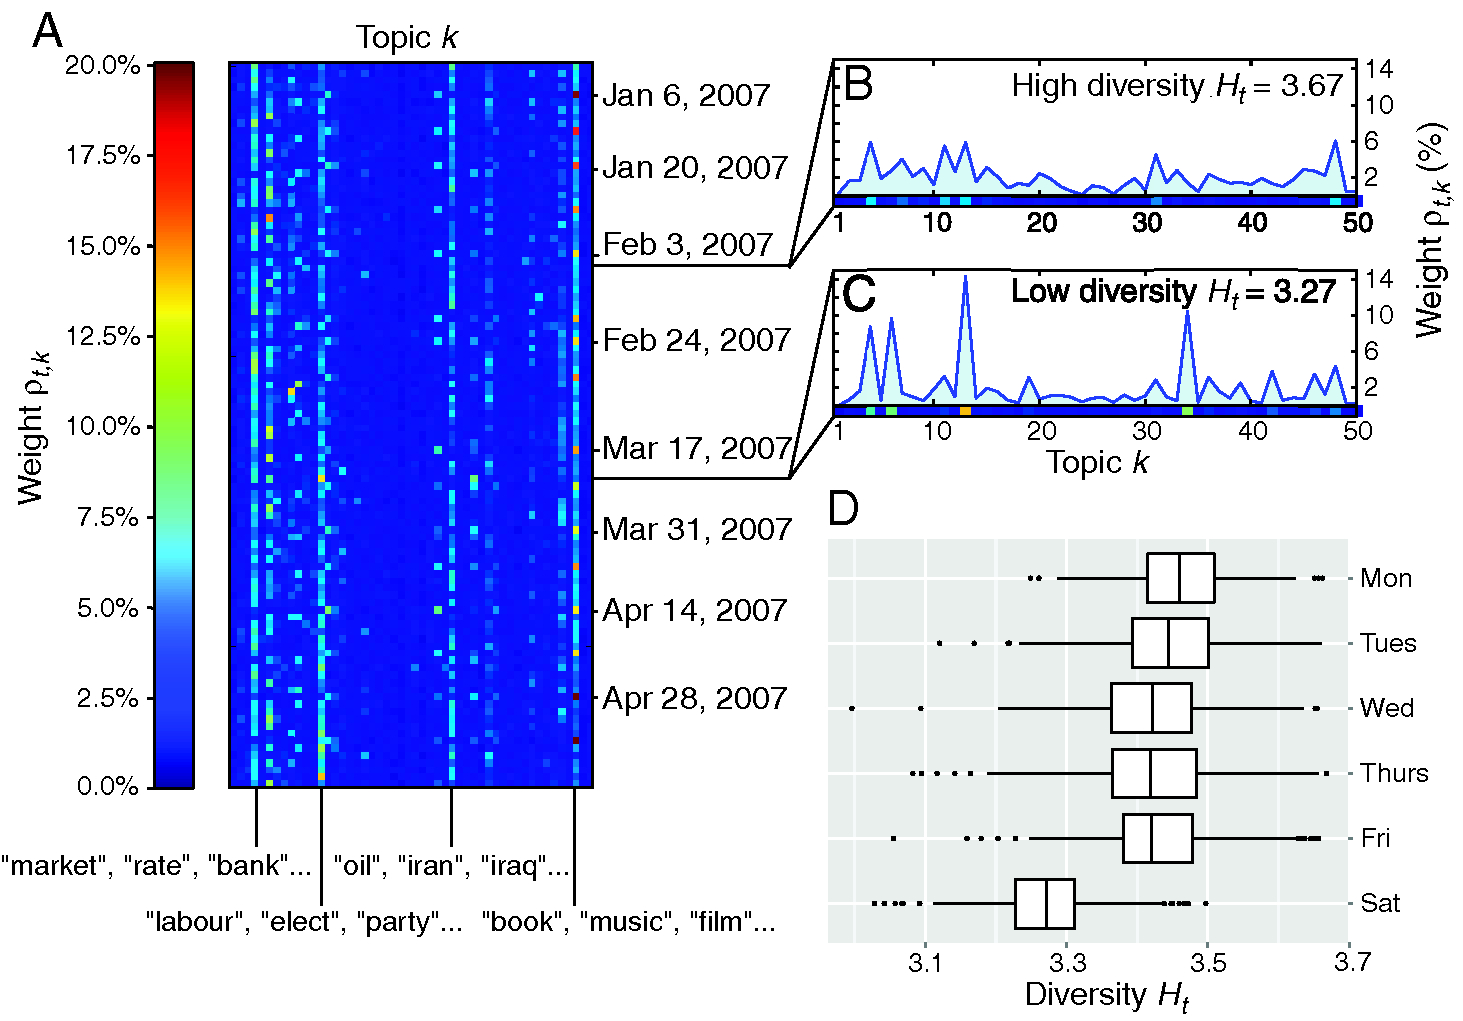
The matrix provides rich information regarding both the detailed and large-scale structure of news to which investors, traders and the public are exposed. The columns of , for example, represent time series of weights for individual topics in the Financial Times. Analyses of these individual time series can provide insight into the commonalities among ebbs and flows of stories into and out of public attention. For example, the median lifetime of a topic, as quantified using the topics’ autocorrelation functions, is found to be thirteen days, or roughly two weeks (see supplementary material, available online).
The question of interest here is how, if at all, the diversity of topics represented in a single issue of news interacts with financial market movements. To quantify this diversity, we seek to assign a single number to the topic distribution that measures the extent to which discussion is concentrated in a few topics, or dispersed in many topics. A natural choice for this quantity is the Shannon entropy (Shannon 1948) of the distribution . This quantity can be thought of as a measure of the uncertainty in : for small values of the entropy, discussion in the news is focused on a narrow range of topics, lending a certain coherence to the text and resulting in low measured “uncertainties”. For large values of the entropy, the topic distribution is relatively uniform, so there is a comparatively wide diversity of topics represented in the text. The entropy of topic distributions derived from LDA has been applied in other contexts, such as the detection of “false” or semantically incoherent documents that are constructed to deceive search engines (Misra et al 2008). In our case, the entropy, which we will refer to as the diversity, is computed as
| (2.1) |
where is entry of the vector and represents the relative weight of topic in the Financial Times on day . In Figures 1(b) and 1(c), we plot the topic distributions, , for two issues of the Financial Times exhibiting high and low diversities, . In Figure 1(d), we examine the presence of weekly seasonalities in news diversity, . We observe characteristically low values of the diversity in weekend issues of the Financial Times, as a large portion of these issues are devoted to a small number of topics that appear infrequently in weekday issues, such as the topic containing the words “book”, “music” and “film”. The weekday issues otherwise display only marginal seasonal effects.
Importantly, we must account for finite-size effects when interpreting the values of the diversity . On days when the Financial Times has relatively little content, for example, it is possible for the diversity to appear low, for no reason other than data sparsity (Zheludev et al 2014; Wang and Huberman 2012). In the analyses below, we additionally control for the number of paragraphs in each issue of the Financial Times.
2.1 News diversity relates to same-day trading volume
The Financial Times is released daily at around 5:00 London time, whereas the continuous trading for the Financial Times Stock Exchange 100 (FTSE 100) components starts at 9:00 London time, Monday through Friday. We are interested in understanding to what extent we can link the diversity of financial news, as quantified by , to subsequent events in financial markets. To ease comparison with financial market movements, and to exclude the influence of special “weekend issues” of the Financial Times, we exclude weekends from the remainder of our analysis. Here, we present evidence that the diversity can improve the accuracies of forecasts of daily trade volume in the FTSE 100. We quantify daily trade volume by differencing the total daily trade volume in the FTSE 100 after a log transformation:
| (2.2) |
where represents the total trade volume on day . The quantity captures fluctuations in trading activity, irrespective of the directionality of price changes, and measures the extent to which investors elect to trade on day .
To isolate the predictive power of the differenced news diversity, , with respect to changes in daily trade volume, , it is necessary to determine the extent to which may be modeled endogenously, ie, using only its past values in the absence of any external inputs. An improvement on such a model using the diversity would suggest that a relationship exists between daily FTSE 100 trade volume and the diversity of financial news. There exist general methods to model a time series using only its past values, autoregressive (AR) terms, as well as the model’s own residuals, moving average (MA) terms. A popular, classical approach to modeling stationary time series in this way is to train an ARMA model (Chan and Cryer 2010; Hyndman and Khandakar 2008), which treats the time series as a linear combination of both AR and MA terms. We find that the fluctuations in trading volume form a stationary time series. A scan of ARMA models reveals the presence of both significant AR and MA terms; for this purpose, we model as an ARMA(1,1) process. Details of the model selection process are provided in the supplementary material.
The ARMA(1,1) model captures the degree to which we may model fluctuations in trading volume endogenously, using only its past values. We next investigate the extent to which changes in news diversity can improve this model. To account for finite-size effects, we add the logarithm of the number of paragraphs in each issue of the Financial Times as an external regressor in the ARMA(1,1) model (Sobkowicz et al 2013). We find that a significant portion of the variance of the residuals in this model can be explained using changes in the diversity (, , ; further details of the fitted model can be found in the supplementary material, available online). This motivates us to include the change in diversity , measured in the Financial Times at around 5:00 on the morning of day , in our model of the volume signal for the same trading day. We therefore add the signal to our model of volume fluctuations , and find a significantly negative coefficient (, , ; further details of the fitted model can be found in the supplementary material, available online). The negative coefficient indicates that falls in news diversity tend to precede increased transaction volumes in the FTSE 100, and increases in diversity tend to precede trading days in which transaction volumes are relatively diminished.
Ultimately, the utility of news diversity in predicting changes in trading volume can be decided through a comparison of errors from out-of-sample one-step forecasts between a purely endogenous model (plus the logarithm of the number of paragraphs in each issue of the news) and a model that includes the diversity fluctuations . We therefore supplement our in-sample tests through a comparison of errors from out-of-sample one-step forecasts between these two models. We fit both models using only the first 70% of the data set, from January 4, 2007 to March 16, 2011. We then compare one-step forecasts on the remainder of the data, from March 17, 2011 to December 31, 2012. Using the Diebold–Mariano test for predictive accuracy (Hyndman and Khandakar 2008; Diebold and Mariano 1995), as before, we find evidence that including the diversity signal in our model of increases out-of-sample accuracy (, , ). In Figure 2, we depict how the difference in squared out-of-sample errors between these two models depends on time. We find that the model incorporating consistently outperforms the endogenous model throughout the test set.
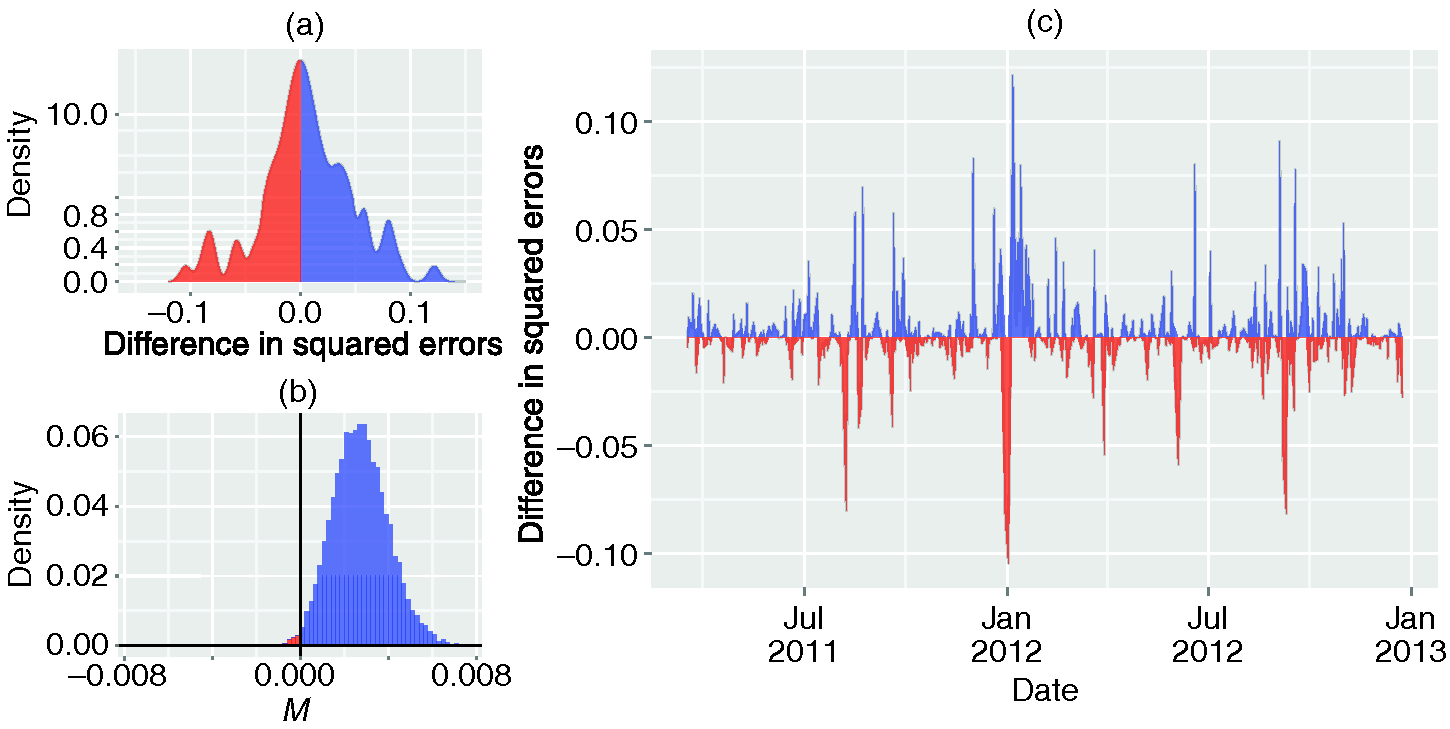
We provide an additional check on the robustness of our results by bootstrapping on empirical residuals. In particular, we compute the differences in squared residuals in the out-of-sample forecasts, and we re-sample with replacement of these points. We then calculate the mean of the differences, where a positive mean indicates that the model including the diversity fluctuations results in smaller squared residuals, on average, than the model that does not include the diversity. We repeat this procedure 10 000 times and depict the distribution of in Figure 2. We again find that the model incorporating consistently outperforms the model without it, as is positive in over 99% of re-samplings, with a 95% confidence interval of [, ]. By re-centering the distribution of to zero, we can test the null hypothesis that including the volume signal does not change the out-of-sample accuracy and, in this case, reject this hypothesis (). We provide details of this test in the supplementary material.
2.2 Price changes of the FTSE drive changes in news diversity
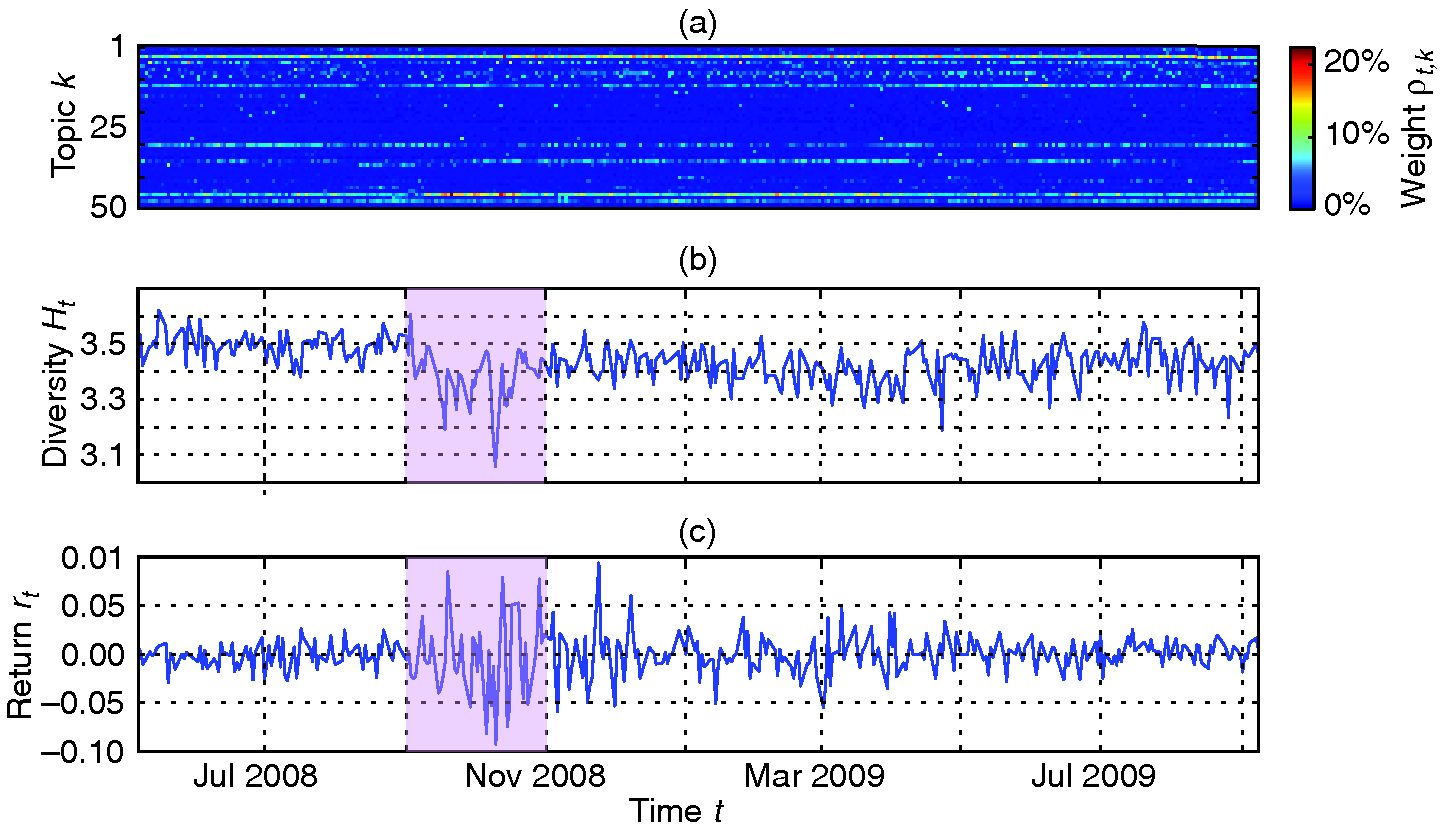
It is also of interest to link the diversity of financial news, as quantified by the diversity , to the direction of financial market movements. In Figure 3, we display the topic vectors for a subset of the time period studied alongside the univariate time series of diversity, . To visually inspect the interaction between market movements and , we also plot the logarithmic returns of the FTSE 100 index. These returns are defined as
| (2.3) |
where is the closing price of the FTSE 100 index on day . From Figure 3, it seems visually clear that, especially during the financial crisis in 2008, there was a tendency for lower values of diversity in the financial news. If a consistent relationship between the diversity and the returns exists, however, it is unclear whether the returns lead changes in , or changes in lead the returns.
To determine the influence of the returns , we first examine the extent to which may be modeled using only its past values . We find that the changes in the diversity from day to day , or , form a stationary time series, which is well modeled by an MA(1) process, according to standard time series model selection methods (see the supplementary material, available online).
Similar to the analysis in Section 2.1, a simple least squares linear regression of the residuals of the MA(1) model against the returns of the FTSE 100 on the previous day suggests that these residuals are, at least in part, related to financial market movements (, , ; further details of the fitted model can be found in the supplementary material, available online). This motivates us to include the previous-day returns of the FTSE 100 in our model of diversity fluctuations. We therefore add the returns to our endogenous model of , finding a significantly positive in-sample coefficient (, , ; further details of the fitted model can be found in the supplementary material, available online). The positive coefficient indicates that decreases in news diversity follow stock market falls, while increases in diversity follow stock market rises. It also bolsters quantitatively what we see qualitatively in Figure 3. In order to consider the influence of finite-size effects, we verify that there is no linear relationship between the logarithm of the number of paragraphs in the Financial Times and the previous-day returns (Pearson , , ). We provide further details of this analysis in the supplementary material.
We supplement our in-sample approach through a comparison of errors from out-of-sample one-step forecasts between a purely endogenous model and a model that includes the returns . As in Section 2.1, we fit both models using only the first 70% of the data set, and evaluate one-step forecasts on the remaining 30% of the data set. We find marginal support for the hypothesis that including the previous-day returns of the FTSE 100 results in an increased out-of-sample accuracy, using the Diebold–Mariano test for predictive accuracy (Hyndman and Khandakar 2008; Diebold and Mariano 1995) as detailed in the supplementary material (, , ). In Figure 4, we depict the time dependence of the differences in squared out-of-sample errors between the purely endogenous model and the comparable model that includes the FTSE 100 returns. We find that the latter is relatively robust in its outperformance of the former, although there are several periods that contribute disproportionately to the effect.
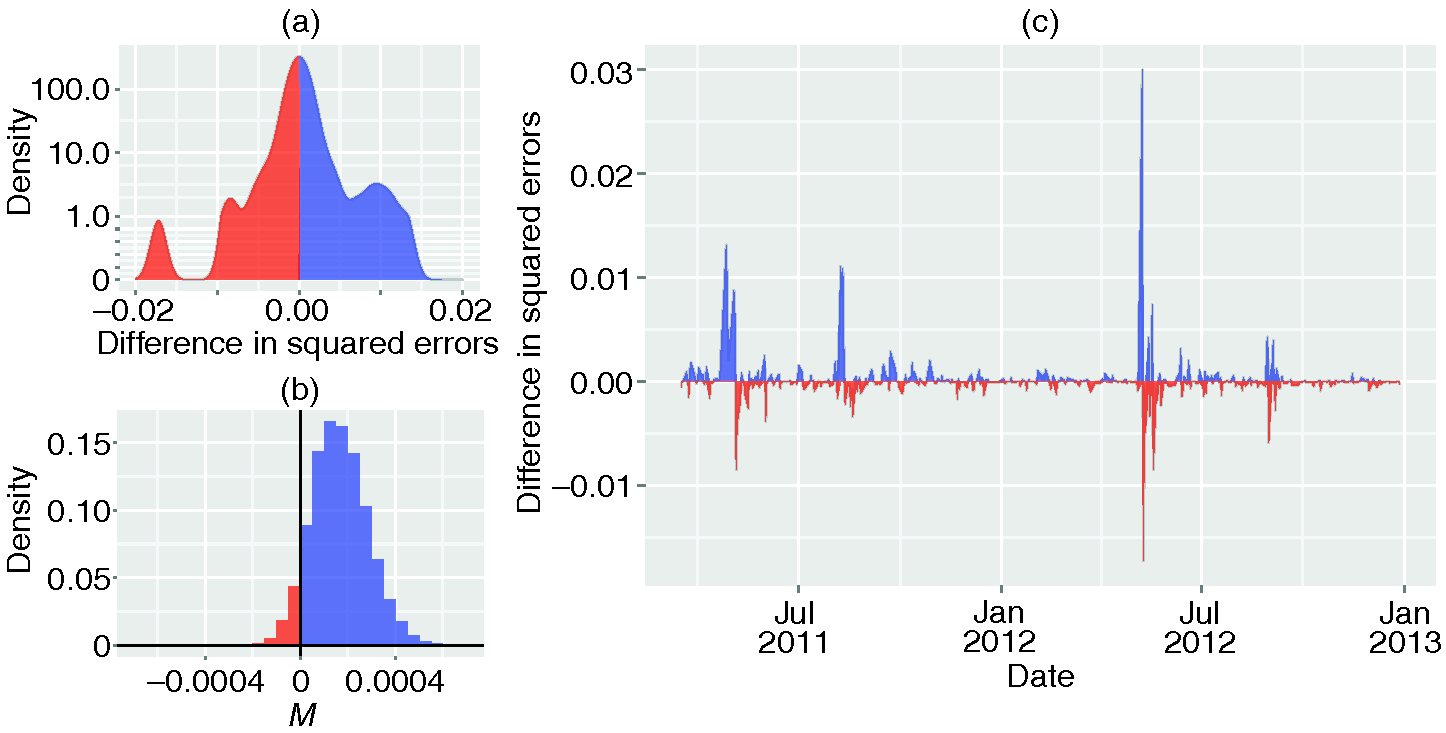
As in Section 2.1, we check the robustness of our results by bootstrapping on empirical residuals. We compute the differences in squared residuals in the out-of-sample forecasts and re-sample with replacement of these points. We then calculate the mean of the differences, where a positive mean indicates that the model including the returns results in smaller squared residuals, on average, than the model that does not include them. We repeat this procedure 10 000 times and provide the distribution of in Figure 4. While the model incorporating outperforms the purely endogenous model in 93% of the re-samplings, we find that our bootstrap statistics do not give us confidence that is indeed positive (95% confidence interval: [, ]). By re-centering the distribution of to zero, we can test the null hypothesis that including the volume signal does not change the out-of-sample accuracy; in this case, we fail to reject this hypothesis (). In summary, our out-of-sample analysis provides only marginal evidence that news diversity could be forecast by the returns of the FTSE 100 on the previous day. However, our in-sample analysis suggests that, at least for the period considered, greater returns in the FTSE 100 tended to be followed by a greater diversity of news on the following day.
We find no evidence that changes in news diversity , measured in the Financial Times at around 5:00 on the morning of day , are related to subsequent price movements, as would be indicated by correlations between the returns and same-day (Pearson , , ) or previous day (Pearson , , ) movements in . To bolster this conclusion, we repeat the above analysis, fitting an ARMA model to the returns and testing the effect of the differenced diversity as an external regressor. We find that the coefficient of is insignificant in the ARMA model (, , ; further details of the fitted model can be found in the supplementary material, available online), and that the news diversity signal offers no improvements to out-of-sample predictions upon repetition of the Diebold–Mariano test (, , ).
We find no evidence for a relationship in which the volume signal studied in Section 2.1 anticipates changes in the diversity . In particular, the correlation between and next-day changes in diversity is low (Pearson , , ). For a more thorough investigation, we include the volume signal in our MA(1) model of and repeat the analysis in Section 2.2. Here, we find that although previous-day changes in trade volume are significant when modeling the news diversity in-sample, they fail to offer any advantage in out-of-sample predictions upon repetition of the Diebold–Mariano test (, , ). Further details of this analysis are provided in the supplementary material.
3 Influence of individual topics
An alternative hypothesis that may also explain the results in the previous section is that a small number of topics individually have a strong negative correlation with previous-day financial market movements. A hypothetical topic discussing market downturns, for instance, could naturally arise more often subsequent to negative returns of the FTSE 100. Spikes in activity for this topic could then decrease the measured diversity , resulting in the observed pattern.
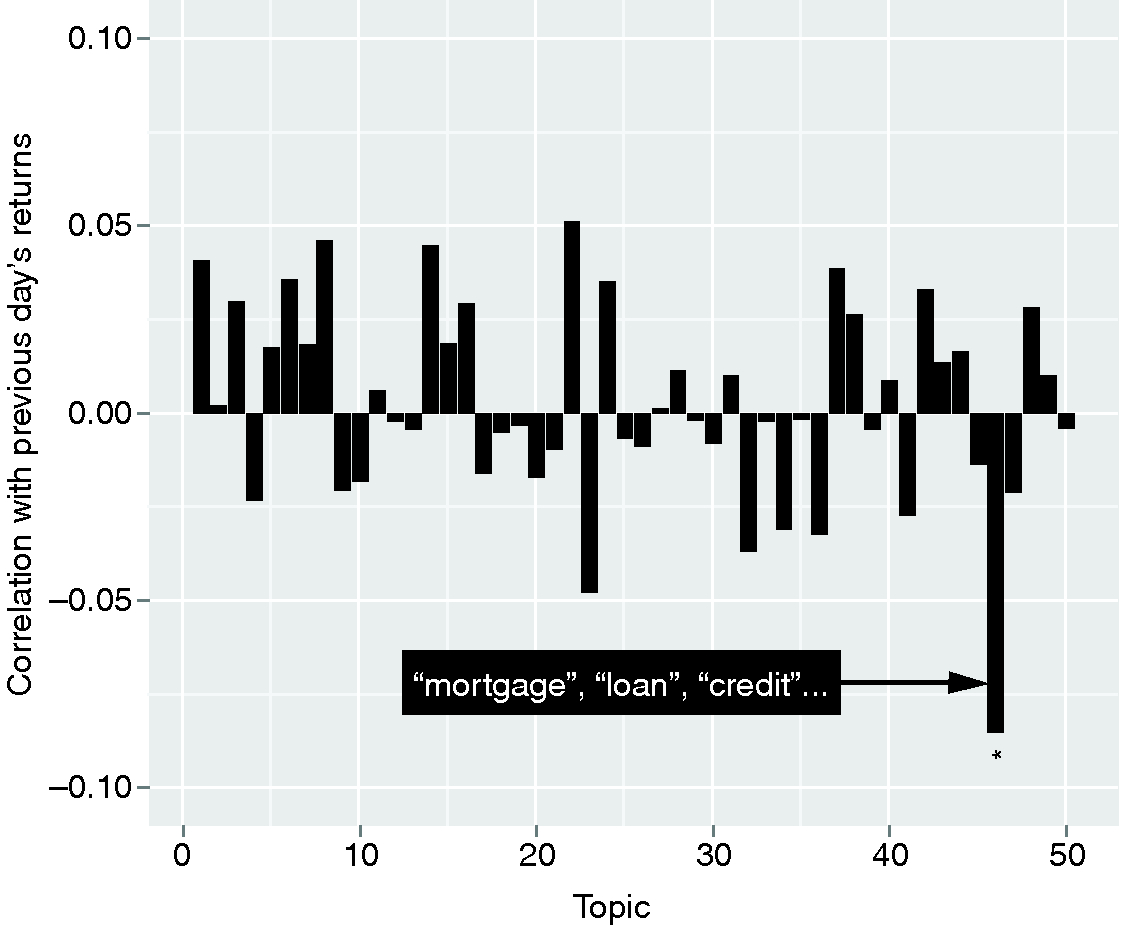
To search for such a topic, we consider separately the fifty columns of . Each of these columns corresponds to a time series of weights of a given topic in each issue of the Financial Times. For each topic, we compute the Pearson correlation between the differences
and the previous-day returns of the FTSE 100. A plot of the correlation coefficients measured for all topics is shown in Figure 5. Only one topic relating to the recent financial crisis of 2008 (“mortgage”, “loan”, “credit”, “debt”, etc) was found to be significantly related to previous-day returns of the FTSE 100 after a false discovery rate (FDR) correction for multiple comparisons (Benjamini and Hochberg 1995). We find that the sign of this relationship is negative, implying a greater interest in this topic following falls in the FTSE 100, and vice versa.
We check the influence of this topic on our previous results by removing it from the analysis. That is, we remove the entry corresponding to this topic from each topic vector , re-compute the matrix and the diversity , and then repeat the comparison with the returns of the FTSE 100. Exclusion of this topic leaves the in-sample results qualitatively unchanged (see tabulated results in the supplementary material, available online). Moreover, upon repetition of the Diebold–Mariano test on the errors of one-step out-of-sample forecasts, we find that inclusion of the previous-day returns of the FTSE 100 results in significantly greater accuracy in predicting changes in news diversity (, , ). We therefore find that changes in the diversity of topics in the news are related to previous-day stock market movements, independent of the reaction of individual topics.
We check the influence of individual topics on the relationship between news diversity and subsequent trading volumes in the same way, by removing each topic from the calculation of the diversity and repeating the analysis of Section 2.1. We find that, upon repetition of the Diebold–Mariano test on the errors of one-step out-of-sample forecasts, the inclusion of news diversity results in significantly greater accuracy in predicting volume fluctuations ( after FDR correction) when almost any single topic is removed from the calculation of news diversity. There are two exceptions. We find that when topic 46 (“mortgage”, “loan”, “credit”, etc; see full list of topics in the supplementary material, available online) is removed, the leading relationship between news diversity and trading volumes is weakened (, after FDR correction). In addition, we find that the result is no longer significant when topic 4 (“market”, “rate”, “bank”, etc) is removed from the calculation of news diversity (, after FDR correction). This topic tends to represent large portions of each issue of the Financial Times, and it therefore has a disproportionate influence on our calculation of the news diversity.
4 Discussion
We find that using topic modeling to quantify the diversity of subjects in the financial news yields fruitful insights into the relationship between investors and the media. Indeed, we find a consistent relationship between the diversity of topics in the news and subsequent fluctuations of trading volume. Moreover, our results suggest that news diversity reacts to falls in the stock market, as discussion concentrates on a small number of topics following drops in the price of the FTSE 100.
We find that the utility of news diversity as a forecasting tool is sensitive to the inclusion of a single topic in our calculations, suggesting that signals extracted from individual topics in a topic-modeling approach can also be useful. A disadvantage of an approach that relies on individual topics is its ambiguity when extending the approach to new corpora, or even to different configurations of topic models on one corpus. The topics discovered by this approach will, in general, be different in these scenarios, so it can be difficult to establish reproducible results. For instance, one might find a topic associated with credit crises to be useful in predicting some aspects of financial markets, but there is no guarantee that the same clustering procedure applied to another source of financial news will identify the same topic. In contrast, the news diversity signal we describe here is constructed by aggregating topics and always exists, so it can be more reliably extended across textual data sets.
Although we restrict our focus to financial news, we make no efforts to filter topics based on their semantic content. Our approach weights all topics equally, regardless of whether they refer to politics, war or the economy. Our analysis suggests that the news that drives the actions of investors may not always have obvious semantic connections with finance or the economy. Abstracting away from individual topics, we find that the cohesion of financial news in particular can be related to recent market downfalls and same-day rises in trading volume.
The Financial Times is one publication in a sea of sources for financial news, with its own biases and dispositions. Nonetheless, boasting an average daily readership of 2.2 million people worldwide (PricewaterhouseCoopers LLP 2010), it offers a reliable sampling of the information to which investors and the public are exposed.
Our analysis is by no means exhaustive, in the sense that there are many ways to measure activity in financial markets that we did not consider. Changes in price and daily transaction volume are among the simplest measures, and it is for that reason they were pursued in this work. We suggest that extensions of these analyses could incorporate more nuanced measures of financial activity, such as the prices of various futures contracts. The robustness of these results in other forms of news, such as discussion on social media, could also be studied. In addition, information-gathering processes, as reflected in online search activity, could offer insight into “herding effects” in public sentiment and its relationship to events in the real world (Curme et al 2014; Moat et al 2013; Preis et al 2013).
Future work could also elaborate on how best to quantify the diversity of news, or changes in the focus of news more generally. Here, we distill the daily news to a single number, the diversity, and study how changes in this number relate to financial market movements. One could also measure the Kullback–Leibler divergence between the topic distributions of successive news issues, retaining information about the coverage of individual topics between distinct days. Such an approach could help distinguish between periods of “monotony” and abrupt changes in the news. In any approach, nonstationarities in the quantities of interest and their relationships to financial or other events could also be carefully assessed.
Going beyond the study of individual keywords or even groups of keywords, the results of our approach suggest that the exploration of “meta-characteristics” of news, of which diversity is one example, may prove a fruitful avenue for research. We suggest that studies of additional features, such as the lifetime of news stories, may shed light on public engagement with different forms of media surrounding a range of real-world events.
Declaration of interest
The authors report no conflicts of interest. The authors alone are responsible for the content and writing of the paper. All authors acknowledge the support of the Research Councils UK Digital Economy Theme via Grant EP/K039830/1. This work was also supported by the Alan Turing Institute under EPSRC Grant EP/N510129/1. This article is distributed under the terms of the Creative Commons Attribution 4.0 International License https://creativecommons.org/licenses/by/4.0/.
Acknowledgements
Details of how data analyzed in this study were obtained are provided in the supplementary material (available online).
References
Alanyali, M., Moat, H. S., and Preis, T. (2013). Quantifying the relationship between financial news and the stock market. Scientific Reports 3, 3578 (http://doi.org/b39b).
Benjamini, Y., and Hochberg, Y. (1995). Controlling the false discovery rate: a practical and powerful approach to multiple testing. Journal of the Royal Statistical Society B 57, 289–300.
Blei, D. M. (2012). Probabilistic topic models. Communications of the ACM 55, 77–84 (http://doi.org/b39c).
Blei, D. M., Ng, A. Y., and Jordan, M. I. (2003). Latent Dirichlet allocation. Journal of Machine Learning Research 3, 993–1022.
Bollen, J., Mao, H., and Zeng, X. (2011). Twitter mood predicts the stock market. Journal of Computational Science 2, 1–8 (http://doi.org/b24rss).
Botta, F., Moat, H. S., Stanley, H. E., and Preis, T. (2015). Quantifying stock return distributions in financial markets. PLoS ONE 10, e0135600 (http://doi.org/b39d).
Chan, K. S., and Cryer, J. D. (2010). Time Series Analysis with Applications in R, 2nd edn. Springer.
Cont, R., and Bouchaud, J. P. (2000). Herd behavior and aggregate fluctuations in financial markets. Macroeconomic Dynamics 4, 170–196 (http://doi.org/cmr677).
Conte, R., Gilbert, N., Bonelli, G., Cioffi-Revilla, C., Deffuant, G., Kertész, J., Loreto, V., Moat, S., Nadal, J.-P., Sanchez, A., Nowak, A., Flache, A., San Miguel, M., and Helbing, D. (2012). Manifesto of computational social science. European Physical Journal Special Topics 214, 325–346 (http://doi.org/f4hvtq).
Curme, C., Preis, T., Stanley, H. E., and Moat, H. S. (2014). Quantifying the semantics of search behavior before stock market moves. Proceedings of the National Academy of Sciences of the USA 111, 11 600–11 605 (http://doi.org/f6cdcp).
Curme, C., Stanley, H. E., and Vodenska, I. (2015). Coupled network approach to predictability of financial market returns and news sentiments. International Journal of Theoretical and Applied Finance 18, 1550043 (http://doi.org/b39f).
Diebold, F. X., and Mariano, R. S. (1995). Comparing predictive accuracy. Journal of Business and Economic Statistics 13, 253–263 (http://doi.org/b39g).
Feldman, R. (2013). Techniques and applications for sentiment analysis. Communications of the ACM 56, 82–89 (http://doi.org/kxb).
Feng, L., Li, B., Podobnik, B., Preis, T., and Stanley, H. E. (2012). Linking agent-based models and stochastic models of financial markets. Proceedings of the National Academy of Sciences of the USA 109, 8388–8393 (http://doi.org/b39h).
Fisher, R. A. (1915). Frequency distribution of the values of the correlation coefficient in samples of an indefinitely large population. Biometrika 10, 507–521 (http://doi.org/cx2wt3).
Gabaix, X., Gopikrishnan, P., Plerou, V., and Stanley, H. E. (2003). A theory of power-law distributions in financial market fluctuations. Nature 423, 267–270 (http://doi.org/d4zc5n).
Gleeson, J. P., Cellai, D., Onnela, J. P., Porter, M. A., and Reed-Tsochas, F. (2014). A simple generative model of collective online behaviour. Proceedings of the National Academy of Sciences of the USA 111, 10 411–10 415 (http://doi.org/f6bm75).
Goel, S., Hofman, J. M., Lahaie, S., Pennock, D. M., and Watts, D. J. (2010). Predicting consumer behavior with web search. Proceedings of the National Academy of Sciences of the USA 107, 17 486–17 490 (http://doi.org/d8jhz7).
Gopikrishnan, P., Plerou, V., Gabaix, X., and Stanley, H. E. (2000). Statistical properties of share volume traded in financial markets. Physical Review E 62, 4493–4496 (http://doi.org/cfp3c2).
Graczyk, M. B., and Queirós, S. M. D. (2016). Intraday seasonalities and nonstationarity of trading volume in financial markets: individual and cross-sectional features. PLoS ONE 11, e0165057.
Haldane, A. G., and May, R. M. (2011). Systemic risk in banking ecosystems. Nature 469, 351–355 (http://doi.org/b57t2q).
Hisano, R., Sornette, D., Mizuno, T., Ohnishi, T., and Watanabe, T. (2013). High quality topic extraction from business news explains abnormal financial market volatility. PLoS ONE 8, e64846 (http://doi.org/f478v9).
Hofmann, T. (1999). Probabilistic latent semantic analysis. In Proceedings of the Fifteenth Conference on Uncertainty in Artificial Intelligence, Stockholm, Sweden, pp. 289–296. Morgan Kaufmann, San Francisco, CA.
Hommes, C. H. (2002). Modeling the stylized facts in finance through simple nonlinear adaptive systems. Proceedings of the National Academy of Sciences of the USA 99, 7221–7228 (http://doi.org/fq932j).
Hyndman, R. J., and Khandakar, Y. (2008). Automatic time series forecasting: the forecast package for R. Journal of Statistical Software 27, 1–22.
Jackson, M. O. (2008). Social and Economic Networks. Princeton University Press.
Lazer, D., Pentland, S., Adamic, L., Aral, S., Barabasi, A. L., Brewer, D., Christakis, N., Contractor, N., Fowler, J., Gutmann, M., Jebara, T., King, G., Macy, M., Roy, D., and Van Alstyne, M. (2009). Computational social science. Science 6, 721–723 (http://doi.org/c9w2g3).
Lux, T., and Marchesi, M. (1999). Scaling and criticality in a stochastic multi-agent model of a financial market. Nature 397, 498–500 (http://doi.org/drcp22).
Majdandzic, A., Podobnik, B., Buldyrev, S. V., Kenett, D. Y., Havlin, S., and Stanley, H. E. (2014). Spontaneous recovery in dynamical networks. Nature Physics 10, 34–38 (http://doi.org/b39k).
Majdandzic, A., Braunstein, L. A., Curme, C., Vodenska, I., Carciente, S., Stanley, H., and Havlin, S. (2016). Multiple tipping points and optimal repairing in interacting networks. Nature Communications 7, 10850 (http://doi.org/b39j).
Misra, H., Cappé, O., and Yvon, F. (2008). Using LDA to detect semantically incoherent documents. In Proceedings of the Twelfth Conference on Computational Natural Language Learning, pp. 41–48. Association for Computational Linguistics, Stroudsburg, PA (http://doi.org/dcs6tk).
Moat, H. S., Curme, C., Avakian, A., Kenett, D. Y., Stanley, H. E., and Preis, T. (2013). Quantifying Wikipedia usage patterns before stock market moves. Scientific Reports 3, 1801 (http://doi.org/b39m).
Moat, H. S., Curme, C., Stanley, H. E., and Preis, T. (2014a). Anticipating stock market movements with Google and Wikipedia. In Nonlinear Phenomena in Complex Systems: From Nano to Macro Scale, pp. 47–59. Springer (http://doi.org/b39n).
Moat, H. S., Preis, T., Olivola, C. Y., Liu, C., and Chater, N. (2014b). Using big data to predict collective behavior in the real world. Behavioral and Brain Sciences 37, 92–93 (http://doi.org/b39q).
Moat, H. S., Olivola, C. Y., Chater, N., and Preis, T. (2016). Searching choices: quantifying decision-making processes using search engine data. Topics in Cognitive Science 8, 685–696 (http://doi.org/b39p).
Oliveira, N., Cortez, P., and Areal, N. (2013). On the predictability of stock market behavior using stocktwits sentiment and posting volume. In Progress in Artificial Intelligence: EPIA 2013. Lecture Notes in Computer Science, Correia, L., Reis, L. P., and Cascalho, J. (eds), pp. 355–365. Springer.
Pišorec, M., Antulov-Fantulin, N., Novak, P. K., Mozetič, I., Grč, M., Vodenska, I., and Smuč, T. (2014). Cohesiveness in financial news and its relation to market volatility. Scientific Reports 4, 5038.
Preis, T., and Moat, H. S. (2015). Early signs of financial market moves reflected by Google searches. In Social Phenomena, Gonçalves, B., and Perra, N. (eds), pp. 85–97. Springer (http://doi.org/b39s).
Preis, T., Reith, D., and Stanley, H. E. (2010). Complex dynamics of our economic life on different scales: insights from search engine query data. Philosophical Transactions of the Royal Society of London A 368, 5707–5719.
Preis, T., Kenett, D. Y., Stanley, H. E., Helbing, D., and Ben-Jacob, E. (2012). Quantifying the behavior of stock correlations under market stress. Scientific Reports 2, 752 (http://doi.org/b39r).
Preis, T., Moat, H. S., and Stanley, H. E. (2013). Quantifying trading behavior in financial markets using Google Trends. Scientific Reports 3, 1684 (http://doi.org/mdf).
PricewaterhouseCoopers LLP (2010). Average Daily Global Audience (ADGA): audited figures. Report, PwC.
Queirós, S. M. D. (2005). On the emergence of a generalised gamma distribution: application to traded volume in financial markets. Europhysics Letters 71(3), 339–345 (http://doi.org/b9chqm).
Schweitzer, F., Fagiolo, G., Sornette, D., Vega-Redondo, F., Vespignani, A., and White, D. R. (2009). Economic networks: the new challenges. Science 325, 422–425.
Shannon, C. E. (1948). A mathematical theory of communication. Bell System Technical Journal 27, 379–423 (http://doi.org/b39t).
Sobkowicz, P., Thelwall, M., Buckley, K., Paltoglou, G., and Sobkowicz, A. (2013). Lognormal distributions of user post lengths in internet discussions: a consequence of the Weber–Fechner law? EPJ Data Science 2, 2 (http://doi.org/b39v).
Tumminello, M., Lillo, F., and Mantegna, R. (2010). Correlation, hierarchies, and networks in financial markets. Journal of Economic Behavior and Organization 75, 40–58 (http://doi.org/dfk5ps).
Uzzi, B., Amaral, L., and Reed-Tsochas, F. (2007). Small-world networks and management science research: a review. European Management Review 4, 77–91 (http://doi.org/c459fp).
Wang, C., and Huberman, B. A. (2012). How random are online social interactions? Scientific Reports 2, 633 (http://doi.org/b39w).
Zheludev, I., Smith, R., and Aste, T. (2014). When can social media lead financial markets? Scientific Reports 4, 4213 (http://doi.org/rpw).
Only users who have a paid subscription or are part of a corporate subscription are able to print or copy content.
To access these options, along with all other subscription benefits, please contact info@risk.net or view our subscription options here: http://subscriptions.risk.net/subscribe
You are currently unable to print this content. Please contact info@risk.net to find out more.
You are currently unable to copy this content. Please contact info@risk.net to find out more.
Copyright Infopro Digital Limited. All rights reserved.
You may share this content using our article tools. Printing this content is for the sole use of the Authorised User (named subscriber), as outlined in our terms and conditions - https://www.infopro-insight.com/terms-conditions/insight-subscriptions/
If you would like to purchase additional rights please email info@risk.net
Copyright Infopro Digital Limited. All rights reserved.
You may share this content using our article tools. Copying this content is for the sole use of the Authorised User (named subscriber), as outlined in our terms and conditions - https://www.infopro-insight.com/terms-conditions/insight-subscriptions/
If you would like to purchase additional rights please email info@risk.net