Credit data: Trump tax cuts have not hurt US states
Tax package is double-edged sword for US states, but credit has strengthened over past year


US President Donald Trump says the package of tax cuts he signed into law last year unleashed an “economic miracle”, and with growth leaping to 4.1% in the second quarter, he has at least this one number on his side. The question is whether it can be sustained.
US states will be hoping it can. For the states, fiscal stimulus is a double-edged sword; constraining their tax receipts in the short term, while potentially spurring more growth over the longer term. For now – as with the aggregate impact of the cuts themselves – things look good.
From mid-2016 until mid-2017, the average credit quality of the 47 states that can be rated by Credit Benchmark dipped 7%. Since then, it has been improving, although it remains below the levels of two years ago.
Averages can be concealing as well as revealing, of course, and it’s worth noting that the credit distribution for US states has widened, now stretching from aaa to bb.
Elsewhere this month, we look at the global credit distribution for different types of borrower – including many that have no public ratings, the diverging fortunes of South African banks compared with their African peers, and the impact that firmer commodity prices are having on the credit strength of US basic materials, oil and gas, and industrials companies.
Global credit industry trends
Figure 1 shows industry migration trends for the most recently published data.
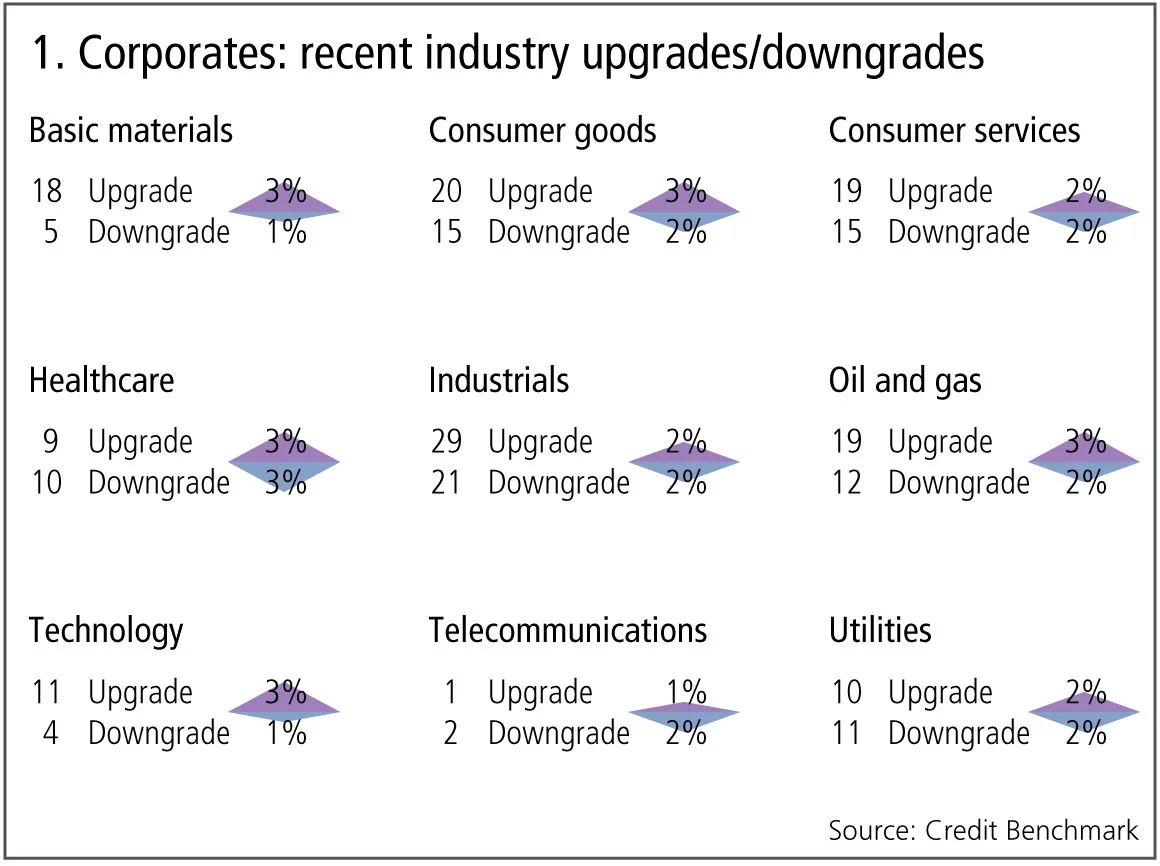
Figure 1 shows:
- Across the global corporate universe, consensus upgrades and downgrades are in balance, with just 2% of global corporate obligors improving, and the same proportion deteriorating.
- Upgrades dominate downgrades in six out of nine industries. One industry is dominated by downgrades and two are balanced.
- Basic materials, oil and gas, and technology continue their trend across the last quarter, with upgrades outweighing downgrades.
- Consumer goods continue last month’s trend of upgrades outnumbering downgrades.
- Telecommunications returns to its trend of downgrades outweighing upgrades.
- Consumer services and industrials are now biased towards upgrades after several months of downgrades dominating upgrades.
- Healthcare has returned to balance after a period that favoured upgrades.
- Utilities continue to be balanced between upgrades and downgrades.
US states
Since taking office, the Trump administration has announced, and in some cases already implemented, a range of fiscal and tariff measures aimed at re-establishing the industrial base of the US. These policies are particularly aimed at states where the traditional economic base appears to have been hit hard by globalisation. Although the initial budgetary impact of expansionary fiscal measures is typically negative, the expectation is that the boost for local industries and employment will ultimately be positive for local and central government finances.
Bank-sourced data now covers 47 of the 50 US states, and figure 2 plots the credit distribution and trends for this group since mid-2016.
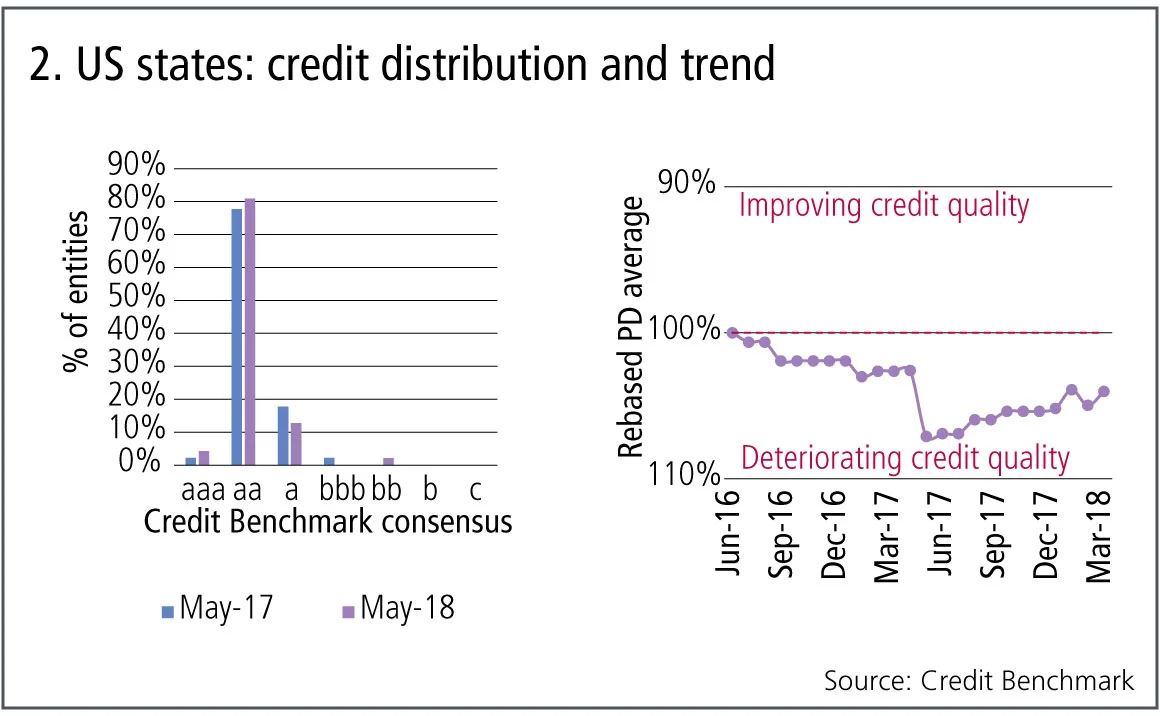
Figure 2 shows:
- 80% of the US states have a consensus rating within the aa category.
- The credit distribution has widened in the past year.
- From mid-2016 to mid-2017, this group of US states saw an average credit deterioration of about 7%.
- Since mid-2017, there has been a modest yet steady improvement in credit quality, although this has not yet recovered to the June 2016 level.
Global credit risk distribution
Bank-sourced data covers a broad range of obligor types, and many of these are otherwise unrated by agencies. Even if a borrower is not covered by contributing banks, the bank-sourced credit distribution provides an initial estimate of the likely range of credit risks.
Figure 3 is based on bank-sourced estimates for around 20,000 corporate, financial, fund and government borrowers across the globe, and plots the distribution of the entities across the seven-category credit benchmark consensus scale.
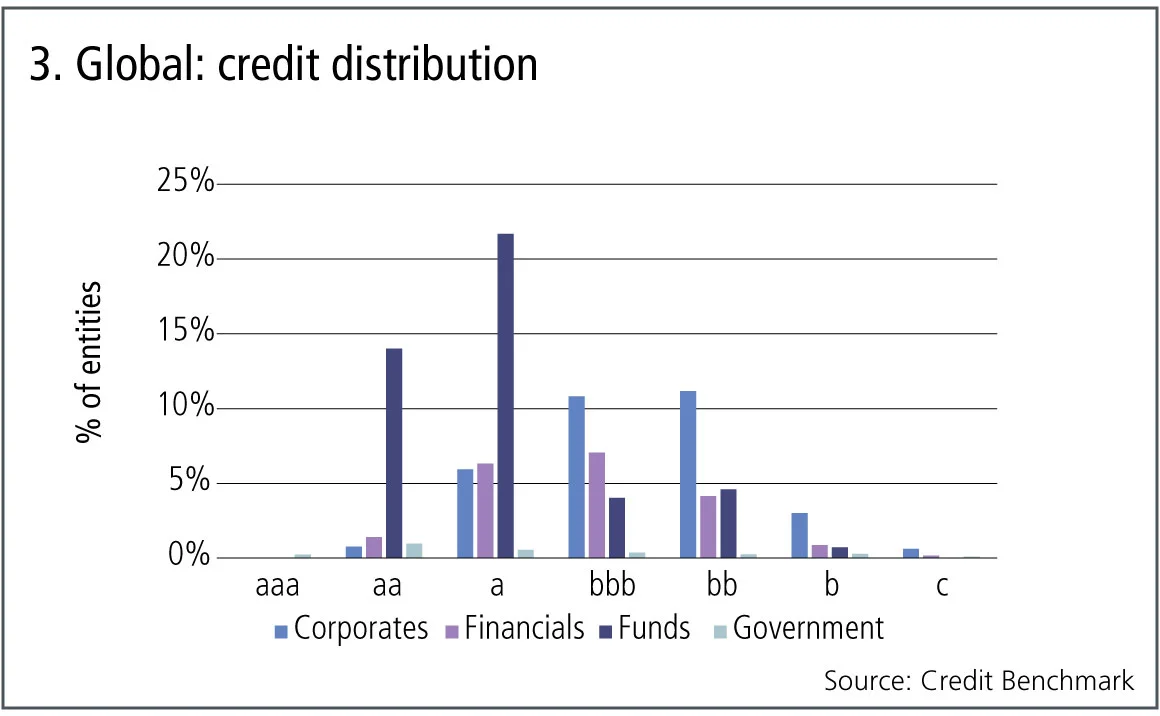
Figure 3 shows:
- For corporates, the credit distribution is broadly symmetric, with the majority in the bbb or bb categories.
- Financials also have a symmetric distribution with the majority in the bbb category. The proportion of the overall total represented by financials in the aa category is slightly higher than for corporates.
- Funds typically have a consensus rating of aa or a, but the distribution has a distinct skew to the right. This reflects mainly the higher risk of hedge funds compared with mutual funds.
- Governments show a “fat-tailed” distribution, with a small proportion in the aaa category and a number of sovereigns and government agencies in the b and c categories. The government mode is in the aa category.
South African vs Africa (ex-South Africa) banks
The African banking industry is increasingly adopting US and European approaches to regulatory oversight and balance-sheet stress testing. These developments have so far stopped short of full implementation of Basel III in most countries, with the notable exception of South Africa. However, S&P downgraded South Africa’s sovereign debt to “junk” status last year, although Moody’s has so far kept them at investment grade, which is aligned with bank-sourced data.
Figure 4 shows the credit trends and credit distribution for 24 South African and 117 African (excluding South Africa) banks and securities firms.
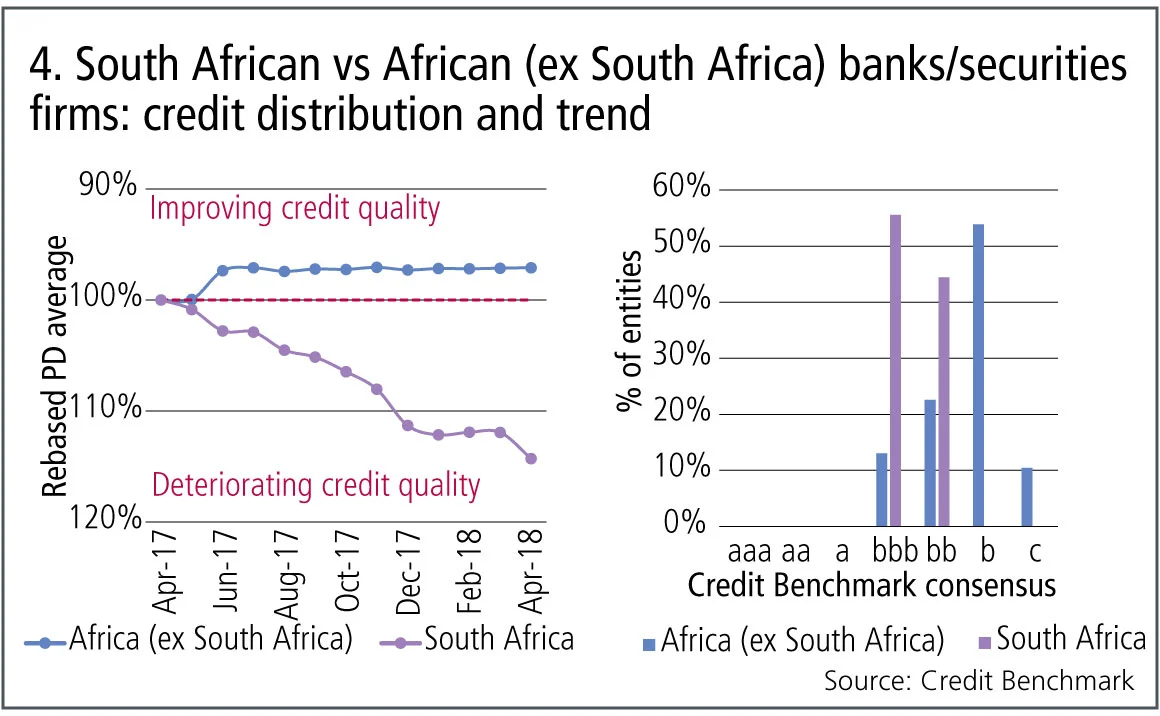
Figure 4 shows:
- There are significant differences in the credit risk trends and credit distribution of South African and African (excluding South Africa) banks and securities firms.
- The left-hand chart shows that the average default probability of African companies in these industries has been stable over most of the last 12 months. It also shows that – despite the South African adoption of Basel III – average credit risk for South African obligors has increased by 14% over the same time period. This probably reflects the S&P downgrade.
- The credit distribution of consensus ratings for South African banks and securities firms shows a tight cluster in the bbb and bb categories; the ex-South African obligors in these sectors have a large proportion in the b category.
US basic materials, oil and gas, industrials
Data from the World Bank shows that most commodity prices – energy and non-energy – are recovering, but are still at significantly below their 2014 levels. This recovery has become increasingly broad based and is expected to continue into 2019. These firmer commodity prices have had a moderately positive impact on credit quality; in a number of countries, credit trends for these global industries are diverging from the domestic sectors.
For example, figure 5 shows credit trends for the largest US companies in the commodity-heavy basic materials (290 borrowers) and oil and gas (390 borrowers) industries, as well as the more general industrials (830 borrowers) segment.
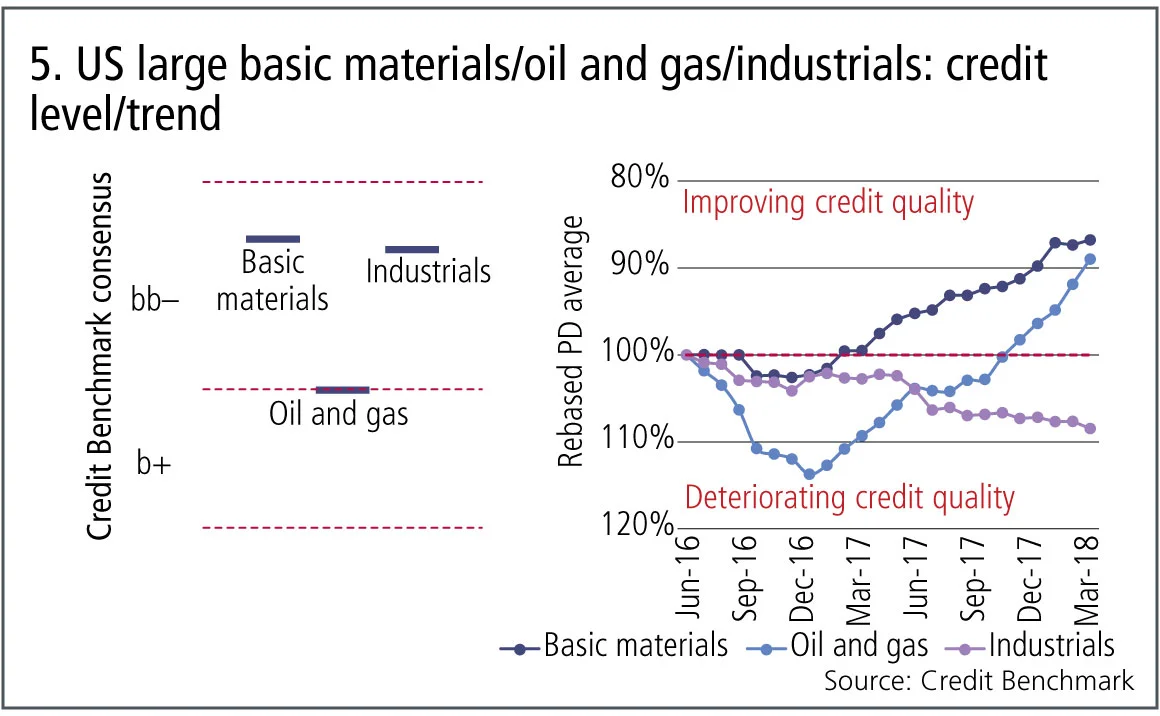
Figure 5 shows:
- Oil and gas has the lowest average credit quality, with a consensus rating of b+; basic materials and industrials both have consensus ratings of bb–.
- Basic materials and oil and gas show similar trends, with oil and gas lagging slightly behind basic materials.
- Credit quality for all three industries – especially oil and gas – deteriorated in the second half of 2016. However, the trend reversed for basic materials towards the end of 2016, and for oil and gas in early 2017.
- Unlike basic materials and oil and gas, industrials have continued to deteriorate into the second quarter of 2018. The overall decline is about 8%.
- In oil and gas, the initial deterioration was rapid with a drop of 14% by late 2016. The steady improvement that followed has brought the industry back to the level of mid-2016.
- Basic materials has seen the greatest overall improvement since mid-2016, with an increase in credit quality of 13%.
David Carruthers is the head of research at Credit Benchmark, a credit risk data provider.
About this data
The Credit Benchmark dataset is based on internally modelled credit ratings from a pool of contributor banks. These are mapped into a standardised 21-bucket ratings scale, so downgrades and upgrades can be tracked on a monthly basis. Obligors are only included where ratings have been contributed by at least three different banks, yielding a total dataset of more than 19,500 names, which is growing by 5% per month.
Only users who have a paid subscription or are part of a corporate subscription are able to print or copy content.
To access these options, along with all other subscription benefits, please contact info@risk.net or view our subscription options here: http://subscriptions.risk.net/subscribe
You are currently unable to print this content. Please contact info@risk.net to find out more.
You are currently unable to copy this content. Please contact info@risk.net to find out more.
Copyright Infopro Digital Limited. All rights reserved.
You may share this content using our article tools. Printing this content is for the sole use of the Authorised User (named subscriber), as outlined in our terms and conditions - https://www.infopro-insight.com/terms-conditions/insight-subscriptions/
If you would like to purchase additional rights please email info@risk.net
Copyright Infopro Digital Limited. All rights reserved.
You may share this content using our article tools. Copying this content is for the sole use of the Authorised User (named subscriber), as outlined in our terms and conditions - https://www.infopro-insight.com/terms-conditions/insight-subscriptions/
If you would like to purchase additional rights please email info@risk.net
More on Comment
Op risk data: Tech glitch gives customers unlimited funds
Also: Payback for slow Paycheck Protection payouts; SEC hits out at AI washing. Data by ORX News

Op risk data: Lloyds lurches over £450m motor finance speed bump
Also: JPM trips up on trade surveillance; Reg Best Interest starts to bite. Data by ORX News

Georgios Skoufis on RFRs, convexity adjustments and Sabr
Bloomberg quant discusses his new approach for calculating convexity adjustments for RFR swaps

In a world of uncleared margin rules, Isda Simm adapts and evolves
A look back at progress and challenges one year on from UMR and Phase 6 implementation

Op risk data: Morgan Stanley clocked in block trading shock
Also: HSBC deposit guarantee gaffe; Caixa hack cracked; reg fine insult to cyber crime injury. Data by ORX News

Digging deeper into deep hedging
Dynamic techniques and gen-AI simulated data can push the limits of deep hedging even further, as derivatives guru John Hull and colleagues explain

How AI can give banks an edge in bond trading
Machine learning expert Terry Benzschawel explains that bots are available to help dealers manage inventory and model markets

Op risk data: US piqued by Pictet tax breach
Also: US Bank’s Covid failings; South Korea’s short-selling clampdown. Data by ORX News