
Monthly credit data review: energy sector firing on all cylinders
Bank-sourced credit data shows rising confidence about oil and gas firms

The energy industry is fighting back. After the struggles of recent years, the latest earnings results from large oil and gas producers show companies in various stages of recovery and rude health. An uptick in oil prices since July adds to reasons for optimism about the sector.
The industry’s brightening prospects are reflected in the most recent credit quality data (see box: About this data). Upgrades of oil and gas firms now outnumber downgrades by three to one – the highest positive ratio of all industries and a stark contrast to only a few months ago, when banks reported twice as many downgrades as upgrades. A number of commodity companies have also moved into investment grade. Elsewhere, the data covers trends for financial and sovereign obligors.
Global credit industry trends
Figure 1 shows industry migration trends for the most recent published data.
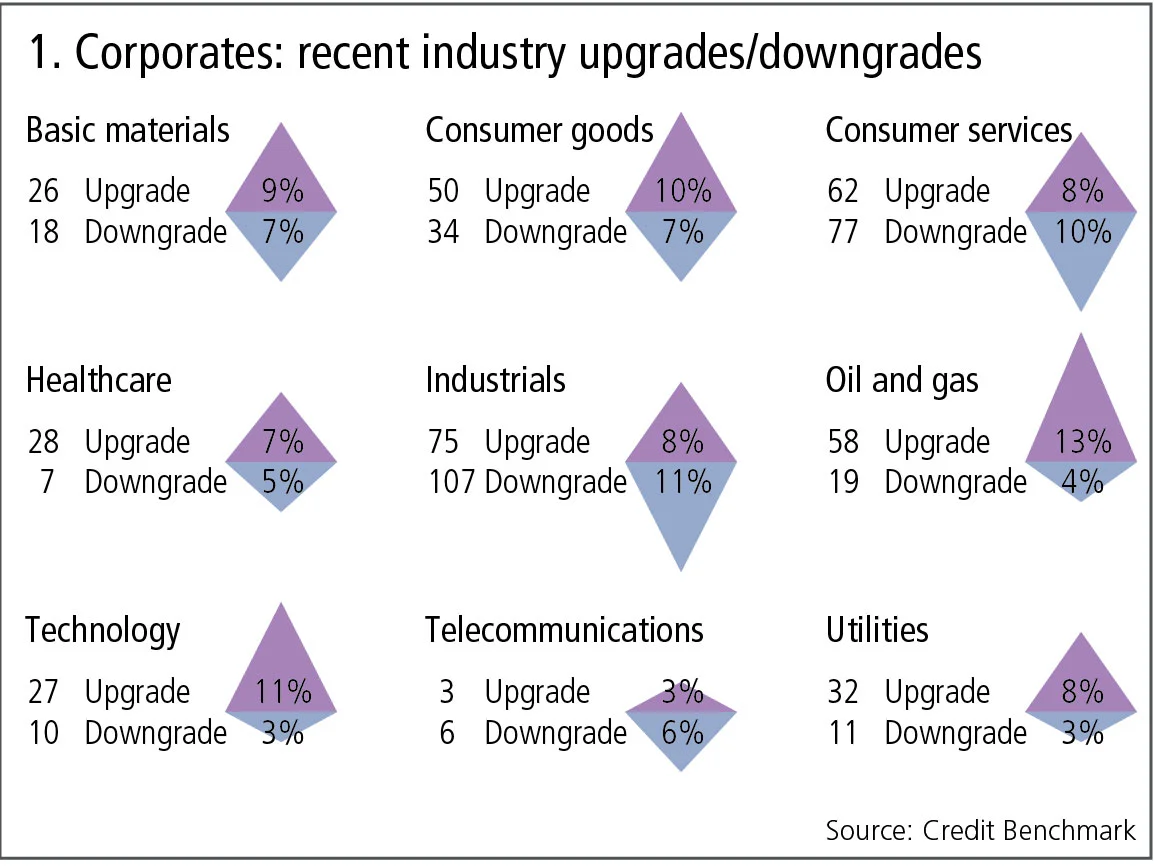
Figure 1 shows:
- The most recent data shows the impact of mid-year reviews across the contributing banks. The number of corporate upgrades and downgrades is about three times higher than usual, and the ratio of upgrades to downgrades has moved into positive territory after a number of months where the ratio was in balance or skewed towards downgrades.
- Oil and gas continue to show a pattern of upgrades outnumbering downgrades, and this ratio has risen from 2:1 to 3:1.
- Healthcare has reversed its recent pattern and upgrades now dominate; technology has continued its recent trend with upgrades outnumbering downgrades.
- Consumer services also continue to show more downgrades than upgrades but the imbalance has reduced.
Upgrade and downgrade trends in corporates and financials
The timing of upgrades and downgrades in bank-sourced credit data is partly driven by different model and calibration review cycles in banks as well as by external events. Corporates and financials can sometimes appear to diverge, but the net balance between upgrades and downgrades shows an underlying consistency in the aggregate credit views of banks that use the internal ratings-based approach to credit risk. Figure 2 shows the trends in upgrades and downgrades for corporate and financial borrowers over the past 12 months.
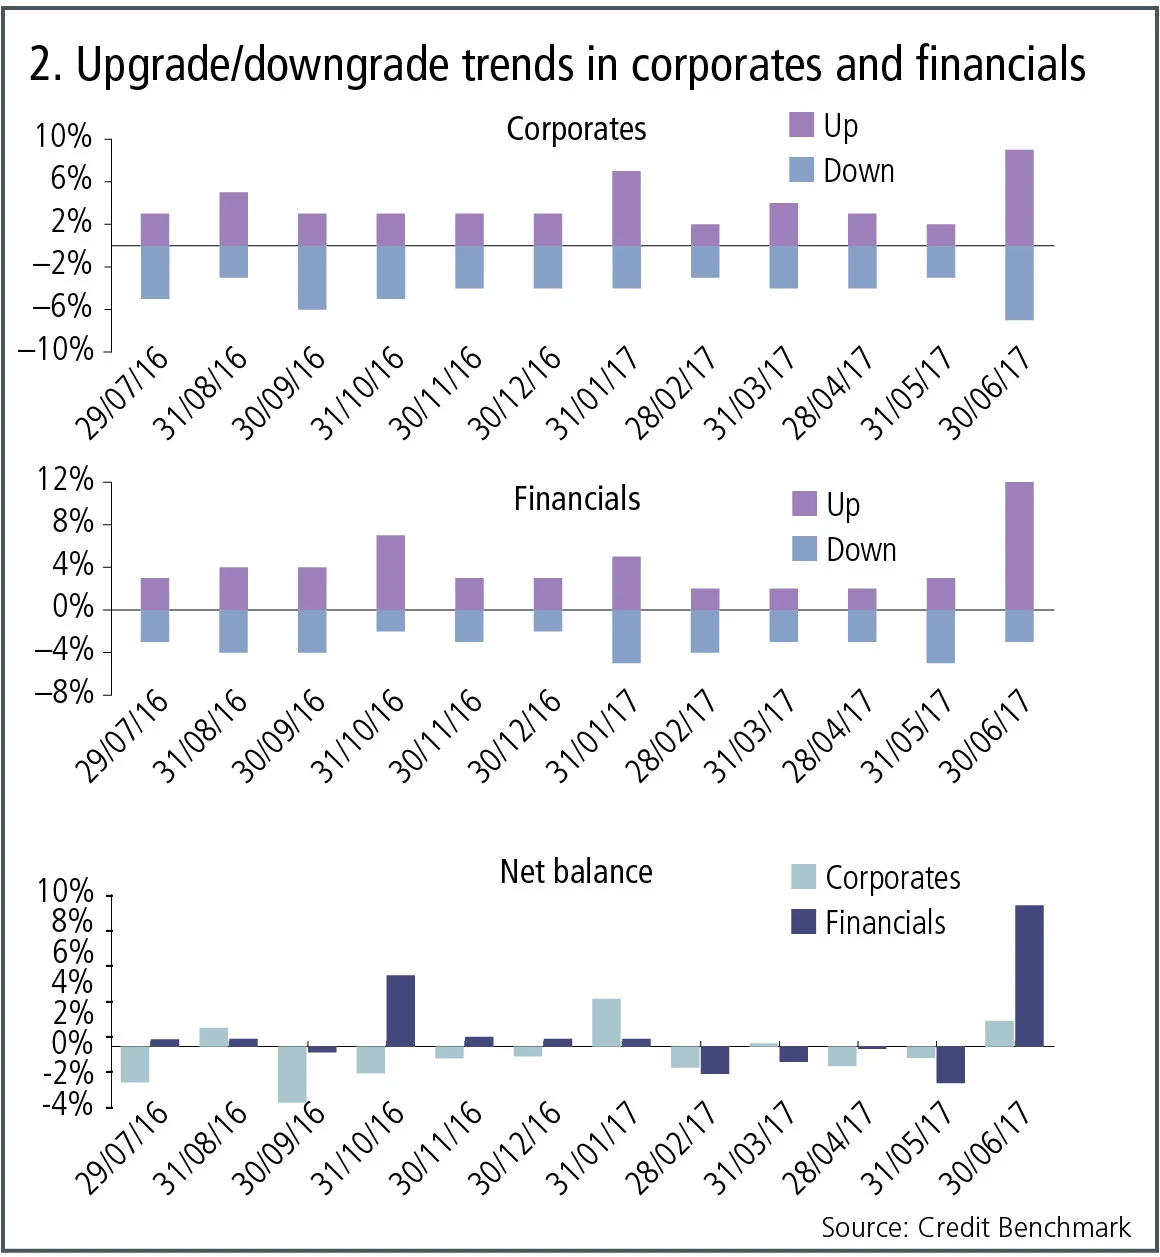
Figure 2 shows:
- Corporate downgrades are at a high, but downgrades for financials are lower than usual.
- The time series of net upgrades for corporates and financials are not strongly correlated, which confirms the typical view that the credit cycles for these two high-level segments have different dynamics.
- The latest data shows the highest net balance of upgrades for financials in the past 12 months.
Sovereign risk: investment grade and non-investment grade
Geopolitics has dominated recent headlines, but the sovereign credit dataset shows some surprising changes for countries that have dropped off the media radar. Figure 3 shows separate graphs for investment grade and non-investment grade sovereigns. Each scatterplot shows the latest creditworthiness estimates on the y-axis; the x-axis shows the equivalent estimate six months ago. Each plotted point represents one sovereign borrower.
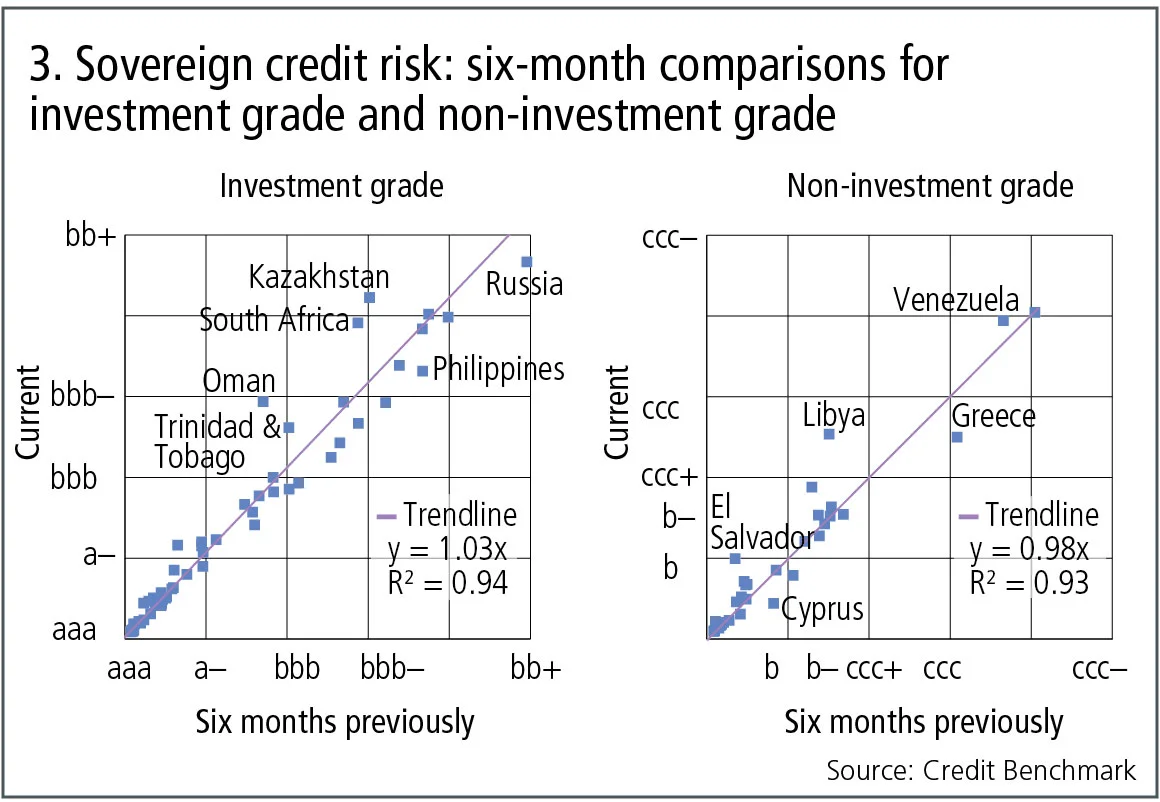
Figure 3 shows:
- Based on the fitted lines, investment-grade sovereigns show slightly increased credit risk over the past six months. For non-investment-grade governments, there has been a slight reduction over the same period.
- Of the investment-grade sovereigns, risk has significantly increased in Kazakhstan, Oman, South Africa and Trinidad & Tobago. There have been reductions in the Philippines and Russia and, as noted last month, Russia is now viewed as investment grade.
- Among the non-investment grade sovereigns, risk has increased in El Salvador, Libya and Venezuela. Cyprus and Greece have shown significant improvements.
Credit ranking for investment-grade segments
Bank-sourced data covers a large and diverse universe of borrowers. There is increasing interest among credit specialists in robust index methodologies that can track changes across the detailed sectors and sub-sectors of this universe. A starting point for research in this area is to assess credit risk in the more aggregate segments. Figure 4 shows current credit rankings.
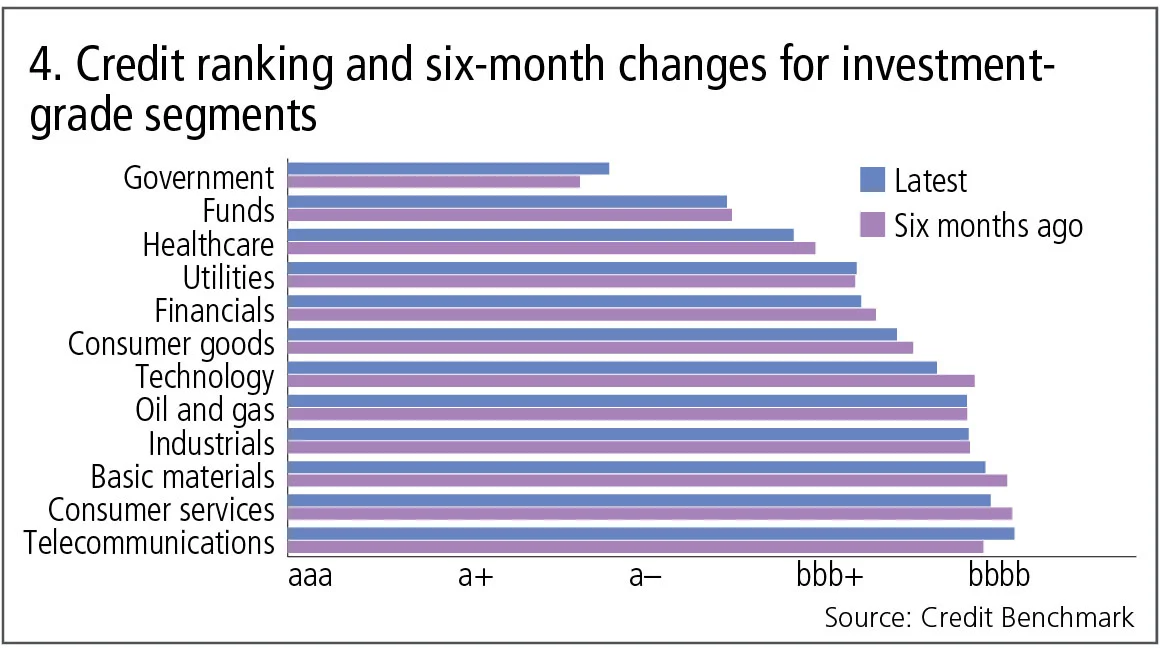
Figure 4 shows:
- Governments and funds have the lowest average credit risk, with the Credit Benchmark Consensus (CBC) rating for a typical investment-grade government obligor of better than a– (an annual risk of less than 0.1% or 10 basis points), and the CBC for a typical fund obligor (ex-hedge funds) is between a– and bbb+ (annual risks of 10–15bp).
- Healthcare, utilities, financials, consumer goods and technology all lie in the CBC range of bbb+ to slightly better than bbb (annual risks of 15–20bp).
- The remaining industries are generally above bbb (an annual risk of at least 22bp), with telecommunications showing the highest risk.
- At this aggregate level, credit risk estimates tend to be quite stable over time. Technology, consumer services, basic materials and healthcare have improved and telecommunications have deteriorated, but the other segments are relatively unchanged.
- In addition to reflecting the credit cycle dynamics of each segment or industry, the average credit risks will reflect the credit distribution of obligors in that segment or industry.
Investment grade: new arrivals and fallen angels
Last month we showed a list of major borrowers that moved into, or out of, investment grade over the past 12 months. Table A shows some of the key corporate and financial companies that crossed this threshold more recently. The investment-grade threshold corresponds to a probability of default of 48bp a year.
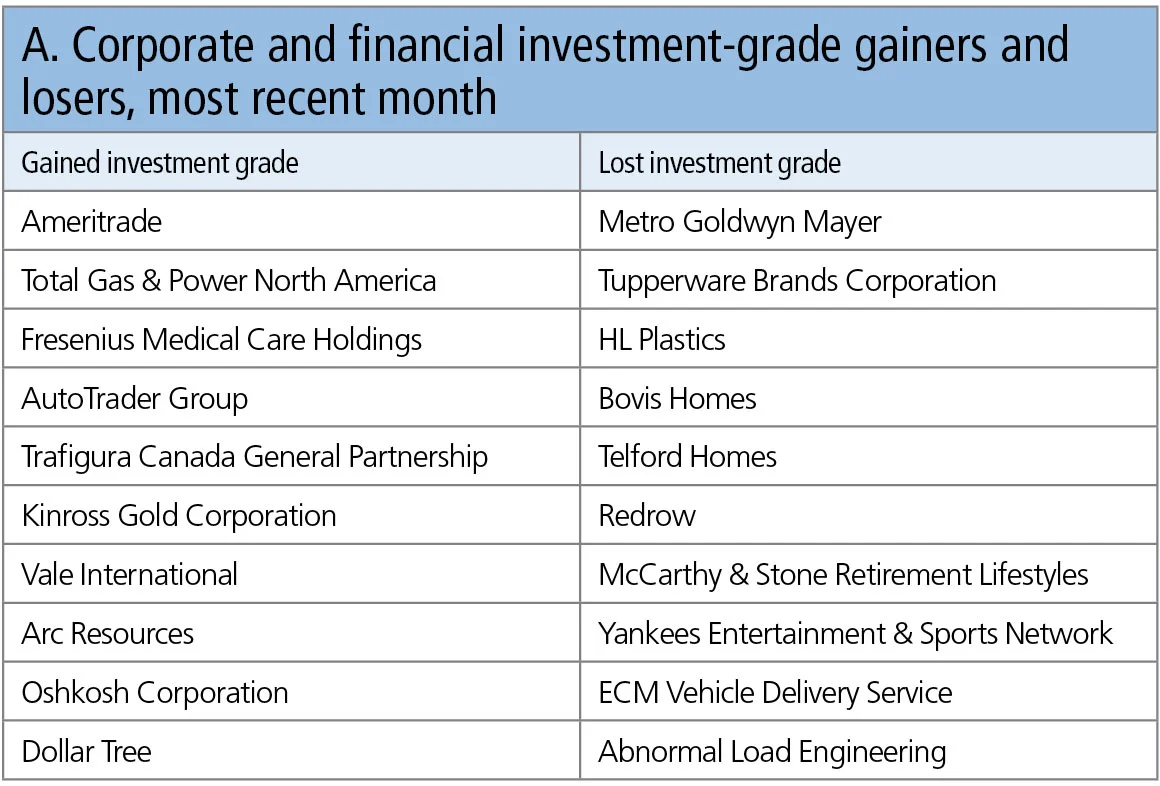
Table A shows:
- There are no significant financials on this list. In the most recent data, most of the changes in financial credit consensus have been in subsidiaries.
- The ongoing recovery in oil and gas that was highlighted in the upgrade/downgrade metrics in Figure 1 is also reflected here.
- Other commodities are also seeing an improvement, with Kinross Gold and Vale International moving back to investment grade.
- There are four UK housebuilders on this list, all having lost their investment-grade status, and this includes retirement specialist McCarthy & Stone. Cala Group is not on the list, having lost its investment-grade status some months ago; its credit consensus has continued to deteriorate. These trends currently appear to be UK-specific.
About this data
The Credit Benchmark dataset is based on internally modelled credit ratings from a pool of 15 contributor banks. These are mapped into a standardised 21-bucket ratings scale, so downgrades and upgrades can be tracked on a monthly basis. Obligors are only included where ratings have been contributed by at least three different banks. The dataset covers more than 10,000 names and is growing by 5% per month.
David Carruthers is the head of research at Credit Benchmark, a credit risk data provider.
Only users who have a paid subscription or are part of a corporate subscription are able to print or copy content.
To access these options, along with all other subscription benefits, please contact info@risk.net or view our subscription options here: http://subscriptions.risk.net/subscribe
You are currently unable to print this content. Please contact info@risk.net to find out more.
You are currently unable to copy this content. Please contact info@risk.net to find out more.
Copyright Infopro Digital Limited. All rights reserved.
You may share this content using our article tools. Printing this content is for the sole use of the Authorised User (named subscriber), as outlined in our terms and conditions - https://www.infopro-insight.com/terms-conditions/insight-subscriptions/
If you would like to purchase additional rights please email info@risk.net
Copyright Infopro Digital Limited. All rights reserved.
You may share this content using our article tools. Copying this content is for the sole use of the Authorised User (named subscriber), as outlined in our terms and conditions - https://www.infopro-insight.com/terms-conditions/insight-subscriptions/
If you would like to purchase additional rights please email info@risk.net
More on Comment
Op risk data: Tech glitch gives customers unlimited funds
Also: Payback for slow Paycheck Protection payouts; SEC hits out at AI washing. Data by ORX News

Op risk data: Lloyds lurches over £450m motor finance speed bump
Also: JPM trips up on trade surveillance; Reg Best Interest starts to bite. Data by ORX News

Georgios Skoufis on RFRs, convexity adjustments and Sabr
Bloomberg quant discusses his new approach for calculating convexity adjustments for RFR swaps

In a world of uncleared margin rules, Isda Simm adapts and evolves
A look back at progress and challenges one year on from UMR and Phase 6 implementation

Op risk data: Morgan Stanley clocked in block trading shock
Also: HSBC deposit guarantee gaffe; Caixa hack cracked; reg fine insult to cyber crime injury. Data by ORX News

Digging deeper into deep hedging
Dynamic techniques and gen-AI simulated data can push the limits of deep hedging even further, as derivatives guru John Hull and colleagues explain

How AI can give banks an edge in bond trading
Machine learning expert Terry Benzschawel explains that bots are available to help dealers manage inventory and model markets

Op risk data: US piqued by Pictet tax breach
Also: US Bank’s Covid failings; South Korea’s short-selling clampdown. Data by ORX News

Most read
- Top 10 operational risks for 2024
- Top 10 op risks: third parties stoke cyber risk
- Japanese megabanks shun internal models as FRTB bites